


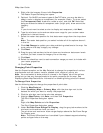
XMap User Guide
78
Note You must select to show USGS quadrangle coverage in the Display tab of the
Options dialog box to view any changes made to the USGS quad line connection
properties on the map. See Displaying Basic Map Features for information on
showing/hiding USGS quadrangle coverage.
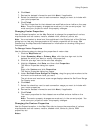
To Change USGS Quad Line Connection Properties
Use the following steps to change the properties of USGS quad line connections.
1. Click the Map Data tab.
2. Under Secondary Map or Primary Map, click the plus sign next to the
dataset for which you want to modify the properties.
3. Click the plus sign next to the sub-data category.
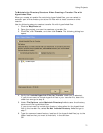
4. Highlight USGS Quad Lines, click Data, and then click Properties.
The USGS Quad Line Connection Properties dialog box opens.
OR
Right-click USGS Quad Lines and click Properties.
The USGS Quad Line Connection Properties dialog box opens.
5. Under Set Data Zoom Range For Display, drag the gray tab markers to the
minimum and maximum level you want.
The minimum and maximum zoom range displays above the Set Zoom Range
For Display area.
6. Click Next.
7. Select the check box next to each connection usage you want to include with
your USGS quad line connection properties.
8. Click Finish.
The USGS quad line connection properties for that dataset are modified and
are visible on the map.
Note The USGS quad line connection property changes are only made in the
current project. You must save your project to retain the property changes.
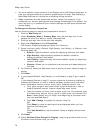
Changing Draw Connection Properties
Use the Properties option on the Map Data tab to change the properties of various
map features, such as draw objects, rasters, vectors, shaded relief, contours, points,
and so on.
To Change Draw Connection Properties
Use the following steps to change the properties of draw objects.
1. Click the Map Data tab.
2. Under Secondary Map or Primary Map, click the plus sign next to the draw
file for which you want to modify the properties.
3. Right-click the draw file and click Properties.
The Draw Connection Properties dialog box opens.
4. Under Set Data Zoom Range For Display, drag the gray tab markers to the
minimum and maximum level you want.
The minimum and maximum zoom range displays above the Set Zoom Range
For Display area.
5. Click Next.
6. Select the check box next to each connection usage you want to include with
your draw connection properties.
7. Click Finish.
The Draw Connection Properties are modified and are visible on the map.