


XMap User Guide
302
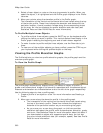
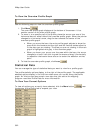
To View the Overview Profile Graph
Use the following steps to view the overview profile graph.
1. Click More
.
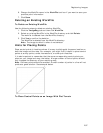
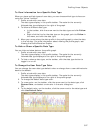
The overview profile graph displays at the bottom of the screen—it is a
smaller version of the main profile graph.
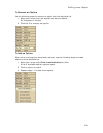
2. To zoom in to a specific part of the profile, place the cursor over one of the
horizontal bars on either side of the overview profile graph. When the pointer
changes to a horizontal arrow, drag the bar towards the center of the
overview profile graph.
• When you move the bars, the main profile graph adjusts to show the
area within the borders and the right and left vertical scales adjust to
fit the data you are viewing. The area you are not viewing in the main
graph is highlighted with grey in the overview graph.
• When you hover your cursor over the area within the bars, the cursor
changes to a hand. Left-click to grab the area and drag it horizontally
to reposition the border focus area or to center the selection on that
point.
3. To hide the overview profile graph, click Less
.
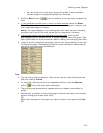
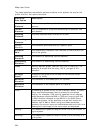
Statistical Data
You can manage the type of statistical data you want to view for a profile graph.
The profile statistic options display to the right of the profile graph. The applicable
selected options display in the info box when move your cursor along the profile
graph. An info box can also contain user data that you add to the mapping
program—see User Profile Data for more information.
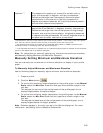
To View Your Current Options
To view all options you currently have selected, click the More button near
the bottom of the Profile tab to expand your view.