


XMap User Guide
74
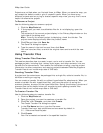
4. Right-click the imagery file and click Properties.
The Raster Properties dialog box opens.
5. Optional. For MrSID and some types of GeoTIFF data, you may be able to
select a color to display as transparent (for example, black). To do so, select
the Transparent Color check box, select a color, and click OK. Note that
doing so makes the default transparent color (bright pink) show around the
imagery.
OR
If you do not want to select a color to display as transparent, click Next.
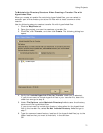
6. Type the minimum and maximum data zoom range for your custom raster
properties in the text boxes.
7. Select the raster data position for that data zoom range from the drop-down
list.
Note The raster data position you select includes all of the options above it
in the list.
8. Click Add Change to update your data positioning selections to the map. You
must perform this step to apply any change.
9. Click Next.
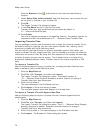
10. Drag the gray tab markers to the minimum and maximum data zoom levels
at which you want to see the imagery file on the map.
11. Click Next.
12. Select the check box next to each connection usage you want to include with
your raster properties.
13. Click Finish.
Changing Point Properties
Use the Properties option on the Map Data tab to change the properties of various
map features such as rasters, vectors, shaded relief, contours, points, etc.
Note You must select to show points of interest in the Display tab of the options
dialog box to view any changes made to the point properties on the map. See
Displaying Basic Map Features for information on showing/hiding points of interest.
To Change Point Properties
Use the following steps to change the properties of point data.
1. Click the Map Data tab.
2. Under Secondary Map or Primary Map, click the plus sign next to the
dataset for which you want to modify the properties.
3. Click the plus sign next to the sub-data category.
4. Highlight Map Points, click Data, and then click Properties.
The Point Properties dialog box opens.
OR
Right-click Map Points and click Properties.
The Point Properties dialog box opens.
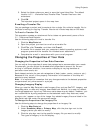
5. Under Set Data Zoom Range For Display, drag the gray tab markers to the
minimum and maximum level you want.
The minimum and maximum zoom range displays above the Set Zoom Range
For Display area.
Note The Show URLs check box is enabled if your dataset supports showing
points as hyperlinks on the map.