


299
Profiling Linear Objects
Creating a Profile
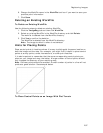
You can use the Profile tab to create elevation graphs of linear objects on the map.
Linear objects can be part of the map or part of a draw layer. A linear object is
profiled from one end of the line to the other. The profile includes statistical data;
you can determine which available data you want to display. You can also create a
profile that includes user data from some athletic devices from Timex and Suunto.
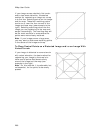
The list below includes samples of map features and draw objects that you can
profile.
•
Routes (created using the
Route tab)
• Trails
• Roads
• Boundaries
• Railroads
• Power lines
• Pipelines
• Streams
• Tracks (created using the Draw tab or imported from
a GPS device)
• Lines (created using the Draw tab)
• Arcs (created using the Draw tab)
• Splines (created using the Draw tab)
• Measure Lines (created with the Measure tool)
Notes
• You can create profiles only on 2-D maps; however, with split-screen
functionality, you can view the highlight of the profiled object on a 3-D map.
• To profile an object or route at any time, right-click the item and click
Profile.
• The Profile graph automatically updates when you select a new object to
profile.
• Double-click a location on the Profile graph to center the map on the location
without changing the data zoom level.
• The highlighted profile object on the map is retained if you go to another tab
and then return to the Profile tab. The selected object is not retained between
program sessions.
• To view all the features available on the Profile tab, click the More button
near the bottom of the tab to expand the view.
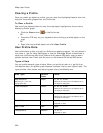
To Create a Profile
Use the following steps to create a profile.
1. Center your map on the area with the linear object you want to profile.
OR
Center the route you want to profile on the map.
2. Click the Profile button
on the Profile tab or on the toolbar to activate
it.
3. Move your pointer over the 2-D map. The pointer changes from
to
when it passes over an object that you can profile.