


Profiling Linear Objects
307
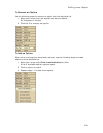
To View Information for a Specific Data Type
When you have multiple types of user data, you can choose which type to focus on
using the "follow" function.
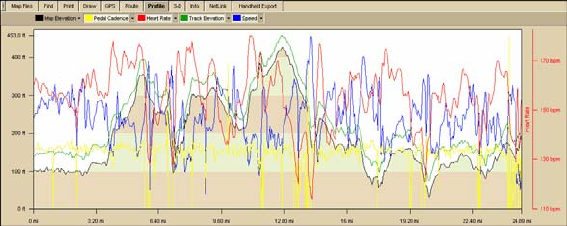
1. Profile a track with user data.
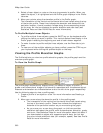
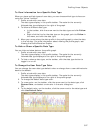
The data types display in the profile toolbar. The scale for the currently
followed data type displays to the right of the graph.
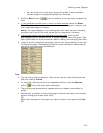
2. To follow a different data type:
• In the toolbar, click the arrow next to the data type and click Follow.
OR
• Right-click the line for the data type on the graph, point to Follow in
the menu, and click the data type.
3. Move your cursor along the data profile in the profile graph to view the data
in the info box. For more information about viewing the profile graph, see
Viewing the Profile Elevation Graphs.
To Hide or Show a Specific Data Type
You can hide and show data on the profile graph.
1. Profile a track with user data.
The data types display in the profile toolbar. The scale for the currently
followed data type displays to the right of the profile graph.
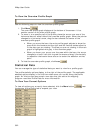
2. To hide or show a data type, on the toolbar, click the data type button to
toggle it on or off.
To Change the User Data Type Color
You can change the user data type default colors or change from a user-defined color
back to the default.
1. Profile a track with user data.
The data types display in the profile toolbar. The scale for the currently
followed data type displays to the right of the profile graph.
2. To change the default data type color:
3. To a new color—on the toolbar, click the arrow next to the data type, click
Choose Color, and select a new color in the color dialog box.
OR
4. To the default color—on the toolbar, click the arrow next to the data type and
click Use Default Color.