


Chapter 15 Menus and Dialog Boxes 365
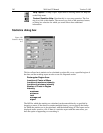
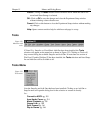
Intensity Levels
Max:
Maximum intensity level in the ROI.
Min:
Minimum intensity level in the ROI.
total:
Sum of all intensity values in the ROI.
avg:
Sum of all intensity values divided by the number of pixels.
sigma:
Standard deviation of all the intensity values in the ROI.
Number of Pixels in Region:
Number of pixels in the ROI.
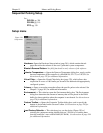
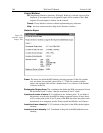
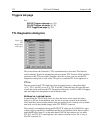
Status bar
The status bar is displayed at the bottom of the WinView/32 window. To display or hide
the status bar, use the Status Bar command in the View menu.
The Status bar displays a variety of different kinds of information about the system
status and data collection. The bar is divided into sections or panes. Progressing from left
to right, the information provided in each section is as follows.
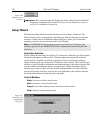
Prompts and Hints:
The left section of the bar provides prompts and tips. More
specifically, this section of the status bar describes actions of menu items as you
use the arrow keys to navigate through menus. This area similarly shows
messages that describe the actions of toolbar buttons as you depress them, before
releasing them. If after viewing the description of the toolbar button command
you wish not to execute the command, then release the mouse button while the
pointer is off the toolbar button.
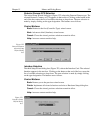
Progress bar:
Next is the progress bar, which advances in increments as the
measurement progresses. The experiment progress can be gauged by the length
of the progress bar. For example, when the bar reaches half of the pane width,
the measurement will be approximately half complete.
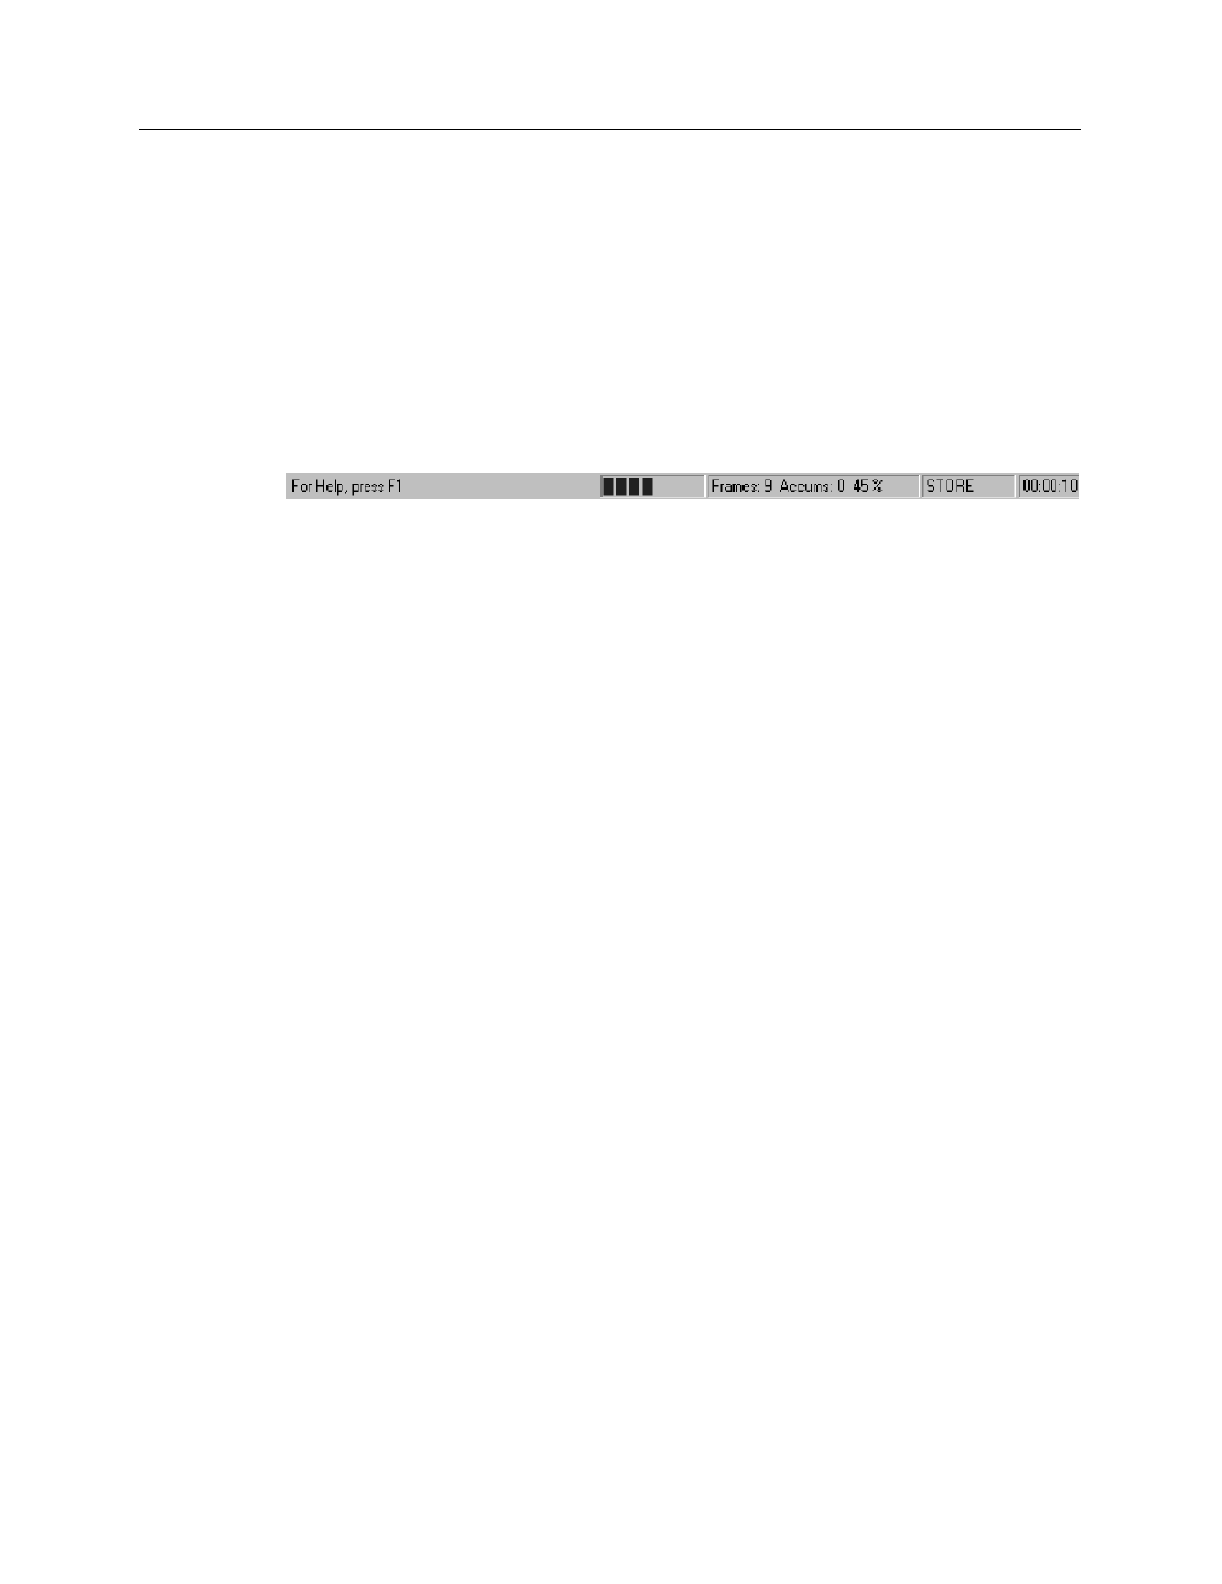
Progress Messages:
The next pane reports the measurement progress in terms of
Frames, Accumulations and % completion.
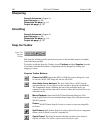
Collection Status:
The next pane reports the run status. Typical messages you might
see in this pane would include RUNNING, STORING, COMPLETE, and
OVERRUN. Left-clicking on the Collection Status pane will cause it to display
the rate at which the currently active window is being refreshed during data
collection (most useful for focus mode). The fastest possible refresh rate is
obtained by setting the Zoom to 1:1 and having both the axes and cross-sections
display OFF.
Clicking again will revert to the collection status message (RUNNING or
STORING). The pane always shows COMPLETE or OVERRUN when data
collection is stopped.
Figure 328.
Status bar.