


Chapter 15 Menus and Dialog Boxes 249
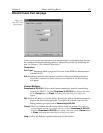
The
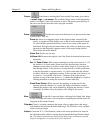
Data window toolbar
has seven buttons (five if viewing a data set as a graph or
3D graph). Descriptions of these buttons follow.
Auto:
Intensity levels are mapped to the display, ordinarily displays 256 (8 bits)
levels. This gives a fast on-scale overview of the data. Different scaling can then
be used to examine regions of particular interest more closely.
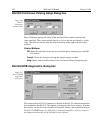
5%-95%:
Function depends on whether data is being displayed as an image or
as a graph. If an image, only data in the 5% to 95% range are displayed. Data
with more than 95% of the maximum intensity are displayed as white, while
those with less than 5% of the maximum intensity are displayed as black. If
displayed as a graph, the data intensity scale is shifted so that it begins at 5% of
range above the X axis and ends at 95% of the Y axis. This assures that there
will be some separation between the data display and the data region boundaries.
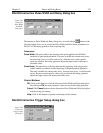
Zoom In:
Allows a rectangular region of the displayed data, selected by the
mouse, to expand to fill the display area so that it can be examined in detail. To
select the data, position the mouse cursor at one corner of the region to be
defined. Next press the left mouse button and, while it is held down, drag the
mouse to the diagonally opposite corner of the region being defined. Then
release the mouse button and click on In.
Zoom Out:
Zooms outward one step.
UnZoom All:
Removes the effect of any number of Zoom-In operations,
restoring the original view.
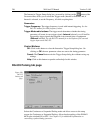
Toggle Fixed Zoom Factor On/Off:
When pressed, Fixed Zoom Factor is
On; equivalent to selecting Fixed Zoom Factor on the Display Layout
Image
Layout
tab page. In released position, Fixed Zoom Factor is Off; equivalent to
leaving Fixed Zoom Factor on the Display Layout Image Layout tab page
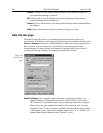
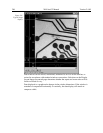
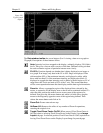
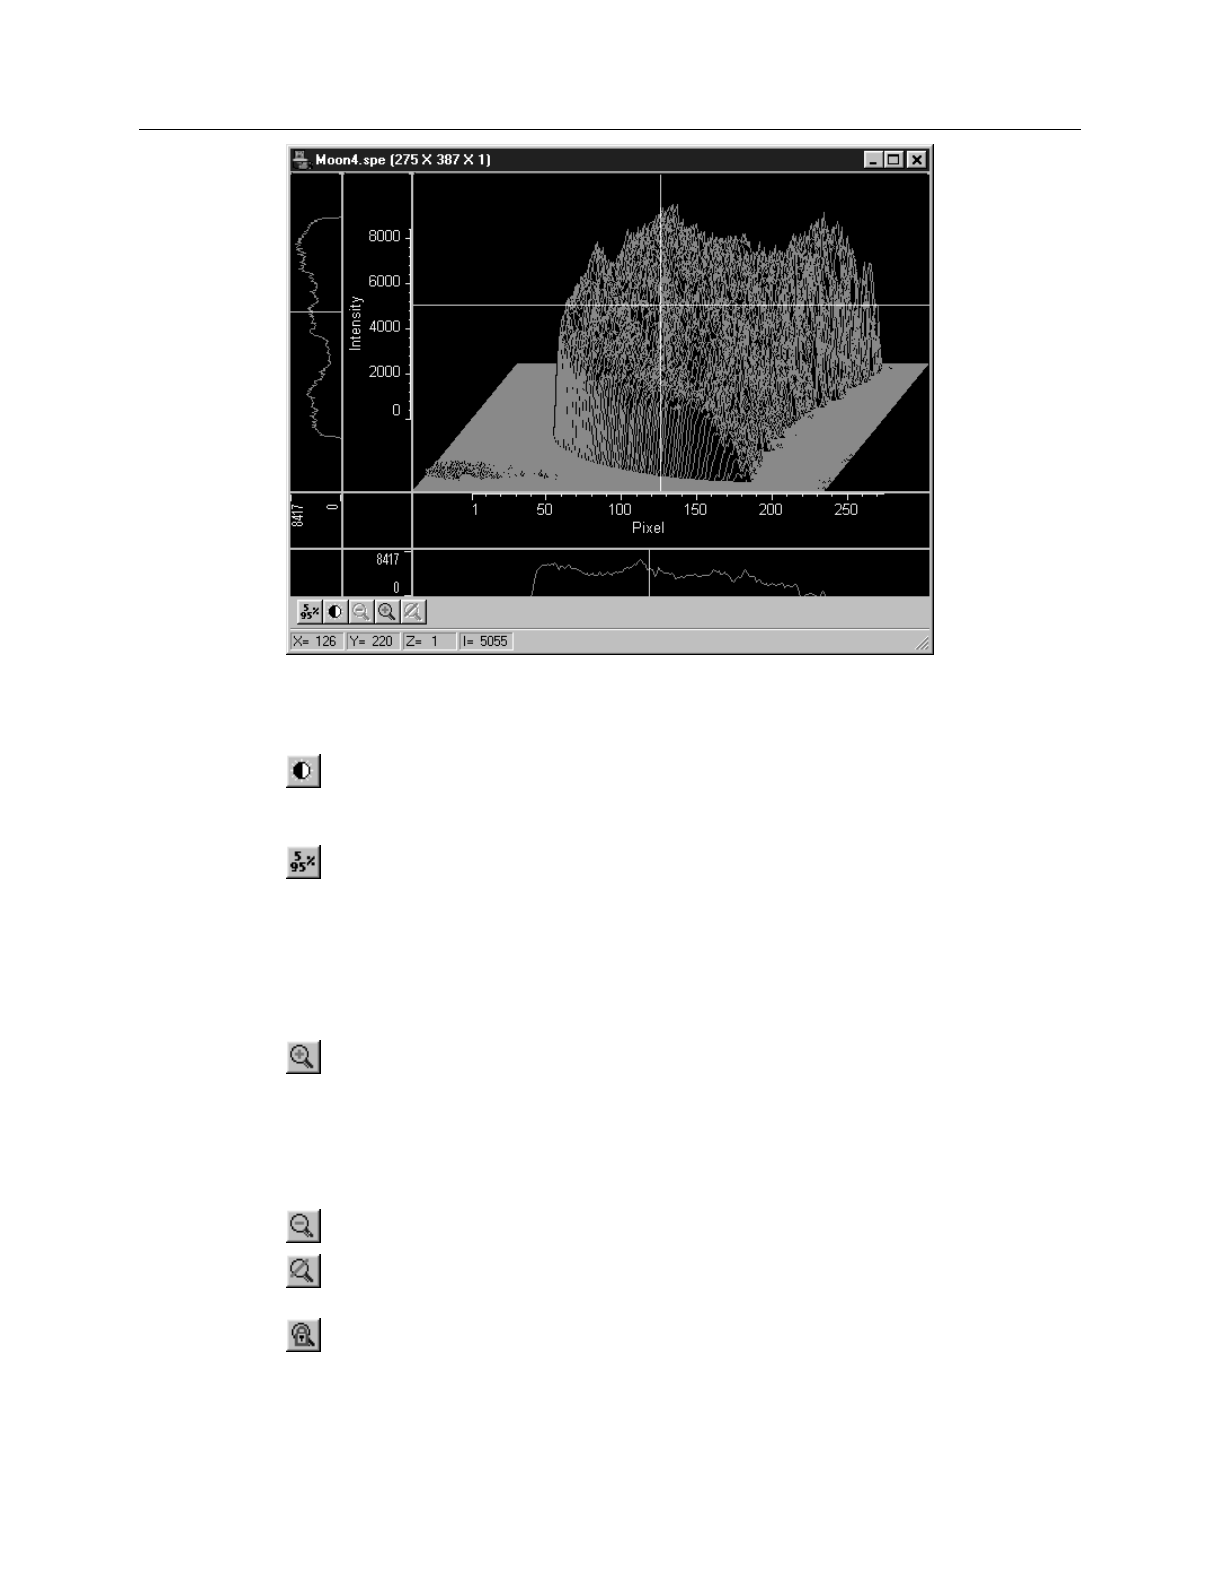
Figure 212.
Typical graph
display.