


Chapter 6 Displaying the Data 119
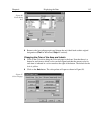
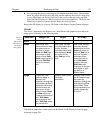
Range tab page
Initial Autoscale:
checked
Set to Full Range:
checked
Frame:
1
Color tab page:
no changes
Axes tab page
Horizontal axis:
checked
Horizontal label:
checked
Horizontal label string:
Pixel
Vertical axis:
checked
Vertical label:
checked
Vertical label string:
Intensity
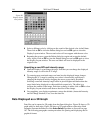
3D Layout
3D Mode:
Multi-strip; same frame selected
3D Properties:
Remove Hidden Line checked; other two boxes unchecked.
Z Axis Endpoint:
%X set to 50; %Y set to 50
3D Marker curves:
Marker Curves unchecked; Curve set to 5
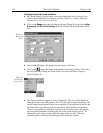
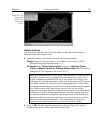
➧ Click on
OK
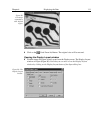
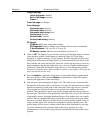
. The Display Layout window will close and the data display, exclusive
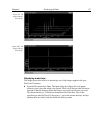
of the intensity profiles, should appear as shown in Figure 103. Each strip is
displayed as a plot of intensity vs. pixel number. The first strip (the one that would
be displayed at the top of an image display) is at the front and the last strip is at the
back. Initially the cursor will be at the lower left. Use the up arrow key to move to a
higher numbered strip and the right arrow key to move to a higher numbered pixel
on the strip. Then click the Intensity Autoscale key to scale the intensity profiles.
Note that clicking the mouse button at different points on the display will change the
pixel selection but not the strip.
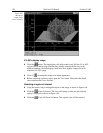
➧ Press the
Insert
key repeatedly. Each time it is pressed the display expands about
the cursor position. Then press the
Delete
key repeatedly to contract the display,
restoring the appearance of the data display.
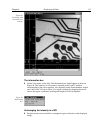
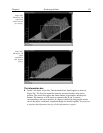
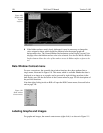
➧ Note the cross sectional displays in Figure 103. The vertical cross-section profiles
the intensity at the same point on each successive strip. The horizontal cross-section
profiles the intensity at each point on the same strip. If the large cursor is selected,
cursor projections will intersect the cross section to show indicate the cursor
position. These projections may not be visually aligned with the cursor position on
the main plot. This effect will be particularly noticeable with a long Z axis. Because
of perspective effects, the higher numbered strips will be further away and visually
smaller. The axes automatically adjust so that they read true for the strip on which
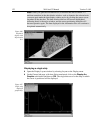
the cursor is located. However, because the cross-section profiles expand to use all
of the available space, they will not be in alignment visually with the cursor. The
profile shapes will be correct, and the point on the profiles intersected by the large
cross-hair extensions will accurately indicate the cursor position. Also, the
information box will accurately report the pixel number and intensity at the cursor
position.