


Chapter 15 Menus and Dialog Boxes 247
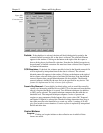
Cancel:
Click on this button to close the Experiment Setup window without making
any changes.
Help:
Opens context-sensitive help for whichever tab page is on top.
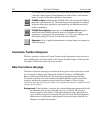
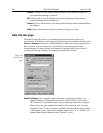
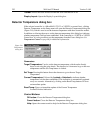
Data window
Opening a data file or collecting data opens a data window. Any number (consistent with
system memory) can be open at once but only one is active. Clicking on a window
makes it active, as indicated by its title bar becoming highlighted. Data can be displayed
as an image, graph or 3D graph as selected via the Display Layout Main tab page or
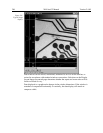
from the Open file dialog box. Figure 211 shows a typical image display.
If
Colorbar
has been selected on the Display menu, Data Window Context menu or on
the Image Display tab page, a colorbar containing the image colors appears above the
image with numbers that indicate the actual range. Similarly, if
Infobar
has been
selected on the Display menu, Display Layout General tab page, or Data Window
Context menu, the X, Y, Z and Intensity values at the cursor position will be listed on the
infobar, which is located directly beneath the Data Window toolbar. The infobar
information is displayed for both image and intensity (graph) displays and appears even
if the cursor isn’t displayed.
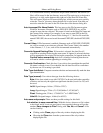
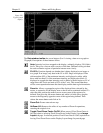
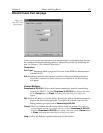
Figure 212 shows a typical display of data as a 3-D graph. Note that the image is shown
with axes and cross-sections. Axes labels are specified via the Display Layout Axes
page. Cross-sections can be shown in both image and 3D graph displays, but not in a
simple two-dimensional display. See Chapter 6 for additional information on data
display.