


Chapter 6 Displaying the Data 125
Hidden surfaces
You may wish to shift the view to show the hidden or underside of the display, as
illustrated in the following procedure.
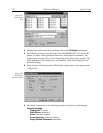
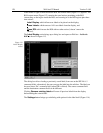
➧ Open the Display Layout window and make the following changes.
Range:
Change Y so that the range is “from 200 to 1” (not “from 1 to 200”).
Change the Step By parameter setting to “3”.
3D Layout:
Select
Show Hidden Surface
and deselect
Highlight Cursor
Curve
and
Marker Curves On
.
Remove Hidden Lines
should be selected.
Change the Z Axis Endpoint to X% 25 and Y% 25.
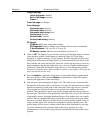
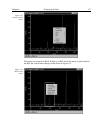
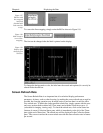
The Z Axis Endpoint can be set by entering values up to 80% X (either polarity)
and 80% Y (positive only) or graphically by using the mouse. If you click on
Adjust Z Graphically and then on OK, the Z Axis Adjust screen (Figure 184)
will appear. To make the adjustment, simply click in the graph area. The data set
will appear immediately so that the effects of dragging the axis will be evident,
allowing the desired display to be achieved in seconds without need for repeated
tries. When working with a high-density data set, every nth line will be
suppressed during the adjustment so that the process remains fast. When the data
is displayed as desired, releasing the button will cause the complete data set to
be displayed with the new orientation. Note that you need not confine the drag
operation to the data screen area, and in fact, it may be necessary to go outside
the area to achieve the desired display. Thus reducing the size of the data
window before readjusting the z-axis can make the operation simpler.
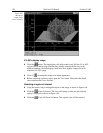
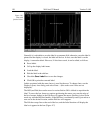
➧ Click on
OK
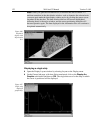
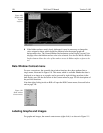
. The data should be redisplayed as shown in Figure 109, with the
hidden surface clearly visible (white lines in Figure 109).
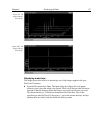
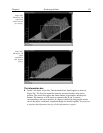
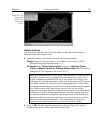
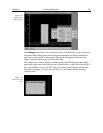
Figure 108. 3D
display with
cursor curve
and marker
curves.