


364 WinView/32 Manual Version 2.4.M
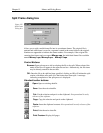
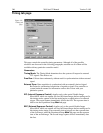
Control Buttons:
OK:
Implements Statistics selections. If Display Window is selected, report will be
displayed. If an output file was designated, report will be written to disk. Both
output to file and output to window can be selected.
Cancel:
Closes Statistics window without implementing any selections.
Help:
Accesses context-sensitive help for the Statistics window.
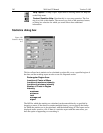
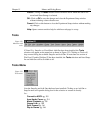
Statistics Report
Frame:
The frame for which the ROI statistics are being reported. If the file contains
only one frame, the reported value will be “1.” If the file contains multiple
frames, the reported value will be a number from 1 to n, where n is the number
of frames in the file.
Rectangular Region Area:
The coordinates that define the ROI are reported; first are
the minimum X and Y values - then the maximum X and Y values.
Location of center of mass:
X,Y coordinate of the “balance point.” If you think of
the intensity at each point in the ROI as being expressed in units of mass, there
will b e some point on the X and Y plane of the ROI data where the plane could
be balanced on an imaginary needle. Points outside the ROI have no influence.
Location of max intensity:
X-Y Coordinate of the pixel in the ROI with the highest
intensity.
Location of min intensity:
X-Y Coordinate of the pixel in the ROI with the lowest
intensity.
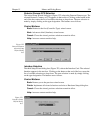
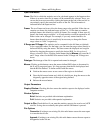
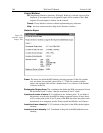
Figure 327.
Statistics report
sample; Full.