


124 WinView/32 Manual Version 2.4.M
Strip Selection
As described above, when displaying data as a graph, the up/down arrow keys can be
used to select a higher or lower numbered strip. This is true if displaying multiple strips
or a single strip. For additional utility where a large change is required,
Shift Home
can
be used to move the selection to the first strip and
Shift End
to move it to the last one.
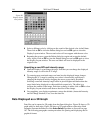
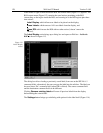
Four of the Custom Toolbar buttons similarly allow the selected strip to be changed
when data is displayed as a graph.
Selects the first strip.
Selects the last strip.
Selects the next strip.
Selects the previous strip.
Note that these buttons have no effect on the strip selection when viewing data as an
image. Instead they select the first, last, next and previous frame respectively if the data
set contains multiple frames.
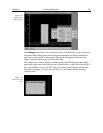
Note:
When displaying the data as a graph, to view data from multiple frames, it is
necessary to select
Same Strip - Multi Frame
on the 3D Layout tab page of the
Display Layout window.
It might further be noted that these buttons may not appear on the default Custom
Toolbar. If so, they must be added using the Customize Toolbar dialog box, accessed by
selecting Custom Toolbar on the Setup menu.
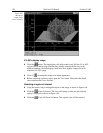
Cursor Curve and Marker Curves
In analyzing a data display, it is often desirable to highlight the cursor curve and to have
every nth curve displayed in a different color as a convenient marker. WinView/32
provides these functions as demonstrated in the following procedure.
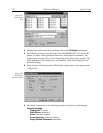
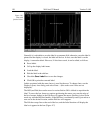
➧ On the 3D Layout tab page, select
Highlight Cursor Curve
and
Marker Curves
On
. Before pressing
OK
, go to the Range tab page and set a Y range of 1 to 385
with a Step By size of 5. This will reduce the number of displayed curves by a factor
of five. This is being done so that all marker curves will be properly displayed (see
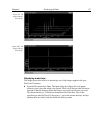
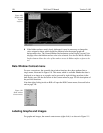
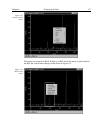
3D Layout tab page discussion in Chapter 15 for explanation). Then press OK. The
cursor curve and marker curves should be clearly delineated as shown in Figure 108.
Note that displaying the data with Highlight Cursor Curve on affects the time
required to step the cursor from curve to curve. If Highlight Cursor Curve is off, the
cursor can step without updating the entire display. If Highlight Cursor Curve is on,
the entire display updates with each step, a considerably slower operation.
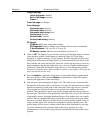
➧ If the Cursor Curve and Marker Curves don’t appear, the problem may be with the
assigned colors, which should be different from the normal graph color and different
from the background color. On the Display Layout Color tab page, the
Active 3D
Graphs
button allows the cursor-curve color to be set. Similarly, the
Marker
Graphs
button allows the marker-curves color to be set.