


206 WinView/32 Manual Version 2.4.M
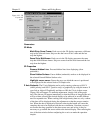
Marker Curves On:
Checking the Marker Curves On box will cause every nth curve,
where n is the number set in the Curve box, to be drawn in the selected Marker
Graphs color.
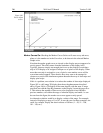
Note that the marker graph curves as viewed on the display may not appear to be
evenly spaced. This effect stems from the limitations of the display itself.
Typically, there are simply not enough pixel rows on the display for each data
strip of a 3D display to be assigned a unique row of pixels on the display. When
more than one strip is assigned to a row of pixels, some marker curves will be
overwritten and not appear. Those that do show may seem to be arranged in
clusters as a result of the interference pattern between the array of data strips and
display pixel strips.
If this is a problem, one solution is to reduce the number of data strips displayed.
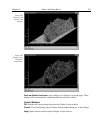
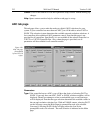
Figure 185 is a full-range 3D display that shows the phenomenon described
above. Figure 186 is a 3D display of the same data file with the same Y range
specified, but with the Step By parameter on the Display Layout tab page set to
5. This reduces the number of data curves to be displayed to one fifth their
previous number, well within the range of what the display can handle. As can
be seen from the figure, the marker curves now appear evenly spaced.
An alternative solution would be to display a subset of the range. For example,
instead of displaying a range of 1 to 387, as was the case for these examples, one
could, for example, display the data in subsets of 50 lines (1…50, 51…100,
101…150, etc.).
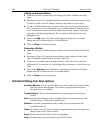
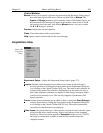
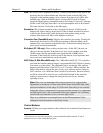
Figure 184.
Z Axis Adjust
screen.