


Chapter 15 Menus and Dialog Boxes 215
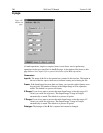
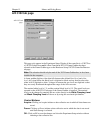
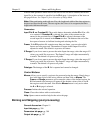
Output Options:
Format:
You have the choice of two output formats, Standard Text or Excel Text.
Select Output File:
Opens a browser for convenient naming of the output file. File
name can also be directly entered via the adjacent text entry window.
Progress:
Indicates calculations progress.
Help:
Opens context-sensitive help for the AUC Analysis snap-in.
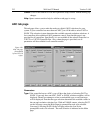
Aux Trig Out tab page
See
PTG Aux Trig Out
tab page on page 333.
Axes
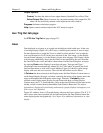
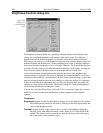
Data displayed as an image or as a graph can be displayed with scaled axes. In the case
of an image display (Figure 191), the X axis is scaled in pixels and the Y axes in strips.
For data displayed as a graph, the X axis is scaled in pixels and the Y axis in intensity.
Axes can be turned on or off via the Axes selection on the View menu, via the Display
Layout General tab page, or via the Display Layout Axes tab page. The Display Layout
Axes tab page additionally allows the axes labels to be specified by the user. Note that
the font used for the scales and labels is that selected via the Font dialog box, accessed
by selecting
Fonts
on the Display Layout Axes tab page. True type and Type 1
(PostScript) fonts are automatically rotated 90° for Y axis labels. In general, the Arial
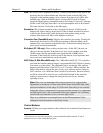
font has been shown to work well for axis labeling. Figure 191 shows a typical image
display with axes and cross-sections. The color bar and infobar are also shown.
If
Colorbar
has been selected on the Display menu, the Data Window Context menu or
on the Image Display tab page, a colorbar containing the image colors appears above the
image with numbers that indicate the actual range. Similarly, if
Infobar
has been
selected on the Display menu, Display Layout General tab page, or Data Window
Context menu, the X, Y, Z and Intensity values at the cursor position will be listed on the
infobar, which is located directly beneath the Data Window button bar. The infobar
information is displayed for both image and intensity (graph) displays and appears even
if the cursor isn’t displayed.
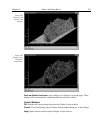
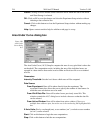
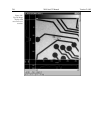
Figure 192 similarly shows a 3D graph display with axes and cross sections. The X, Y, Z
and I values at the cursor position are also indicated below the Data Window button bar
when displaying the data graphically. See Chapter 6 for additional information on data
display.