


107
Chapter 6
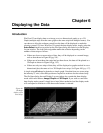
Displaying the Data
Introduction
WinView/32 can display data as an image, as a two dimensional graph, or as a 3 D
Graph (multiple strips from the same graph or the same strip from multiple frames). You
can choose to allow the software control how the data will be displayed or make the
selection yourself. To have WinView/32 control the data-display mode, simply select the
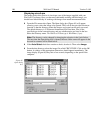
Auto-Select
check box provided on the File Open dialog box and also on the Display
Layout window. The Auto Select algorithm makes the selection depending on the
number of data strips as follows.
If there are eleven or more strips of data, they will be displayed as a normal image,
such as that shown in Figure 80 (pg. 101).
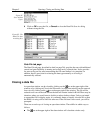
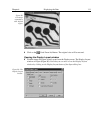
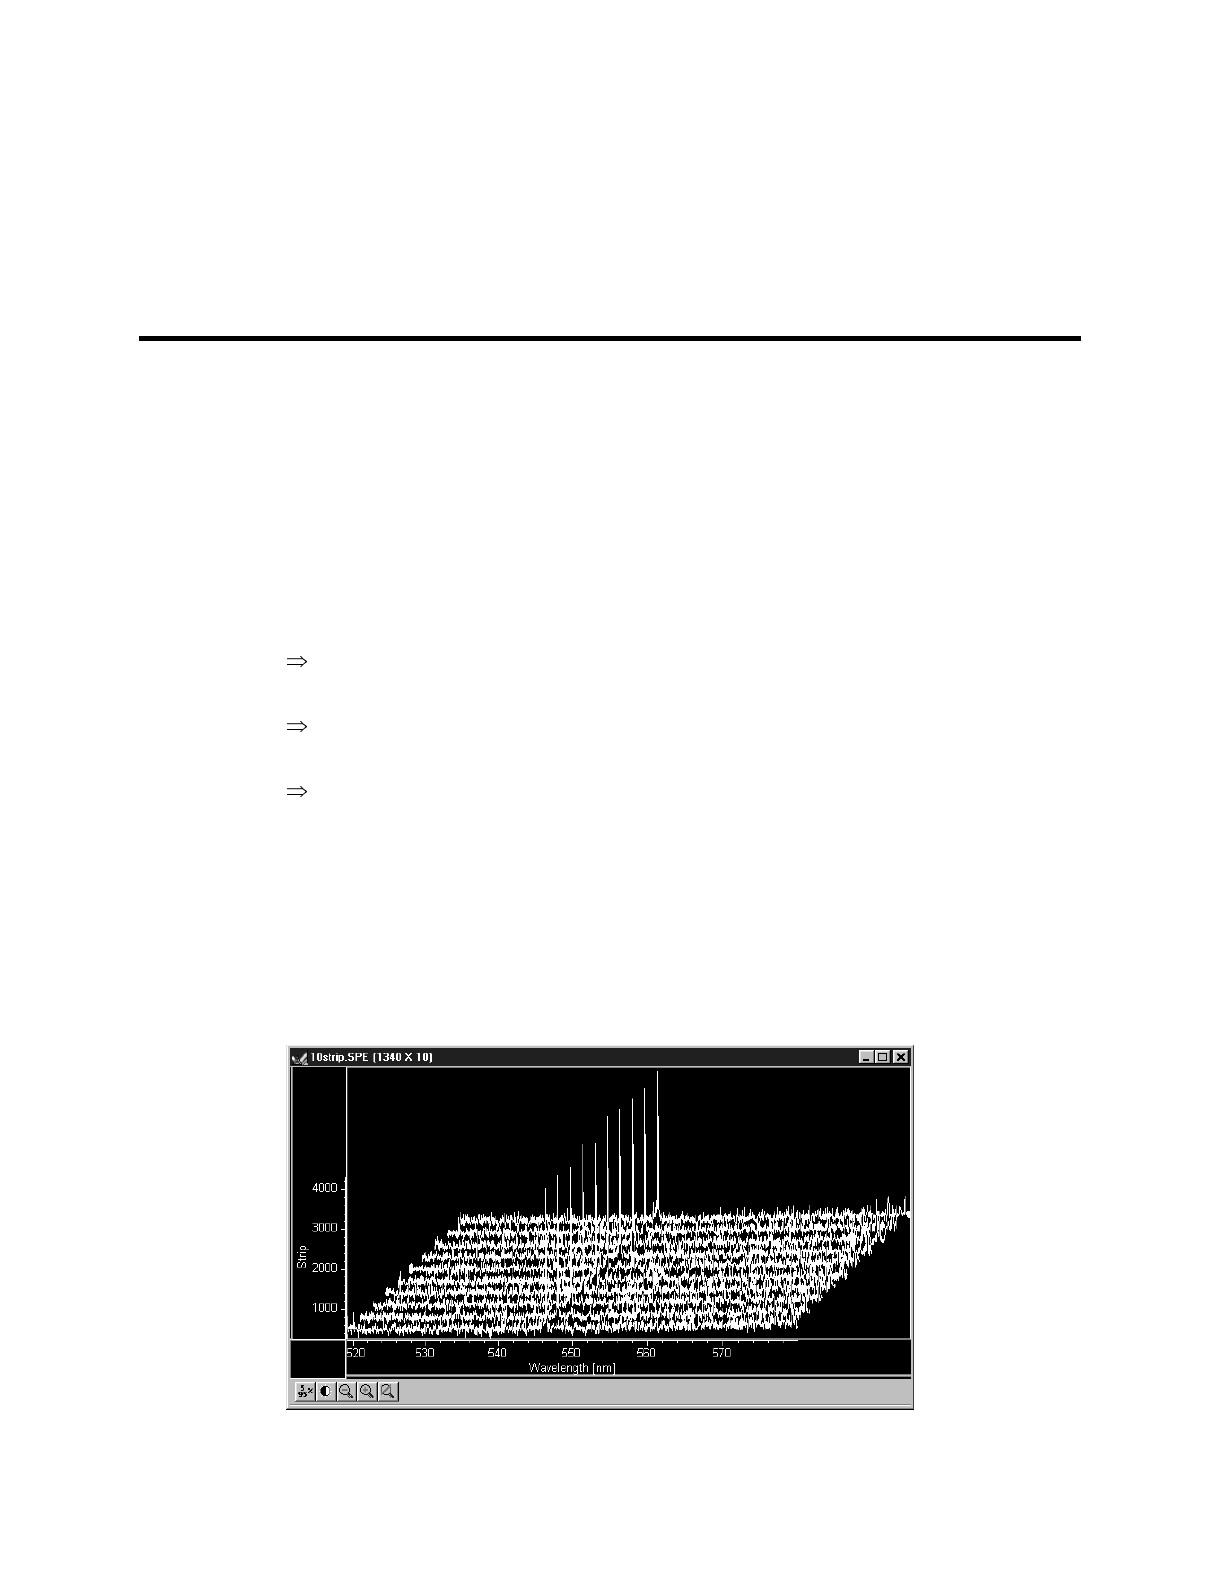
If there are at least three data strips but less than eleven, the data will be plotted as a
3D Graph as shown in Figure 84 (pg. 107).
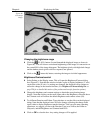
If there are only two strips of data, they will be displayed as graphs stacked in a two-
dimensional plot, the same as for a 3D Graph of two strips. See Figure 100 (pg. 117).
A single strip
will always
be plotted as a simple graph. Note that from two to ten strips,
the intensity (Y axis) scale shifts position as required to read true for the selected strip.
The file Open dialog box and Display Layout window also contain the three display-
mode select radio buttons,
Image
,
Graph
and
3D Graph
. If you wish to control the
data-display mode yourself, simply leave Auto Select unchecked and the display mode
will correspond to whichever of the three radio buttons is selected.
Figure 84.
3D Image
display of ten
data strips.