


Chapter 15 Menus and Dialog Boxes 205
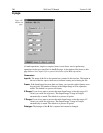
Parameters
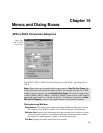
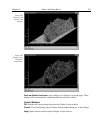
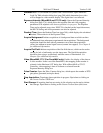
3D Mode
Multi-Strip, Same Frame:
Each curve in the 3D display represents a different
strip on the selected frame. Strip one has the lowest Z axis value and the last
strip the highest.
Same Strip, Multiframe:
Each curve in the 3D display represents the same
strip but from different frames. Strip one comes from the first frame and the last
strip from the highest.
3D Properties
Remove Hidden Line:
.Prevents hidden lines from displaying (often
preferable).
Show Hidden Surface:
Causes hidden (underside) surfaces to be displayed in
the selected Normal Hidden Surface color.
Highlight cursor curve:
Causes the curve on which the cursor is positioned
to be displayed in the selected Active 3D Graph color.
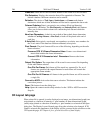
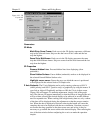
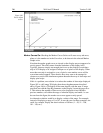
Z Axis Endpoint:
The Z Axis Endpoint can be set by entering values up to 80% X
(either polarity) and 80% Y (positive only) or graphically by using the mouse. If
you click on Adjust Z Graphically and then on OK, the Z Axis Adjust screen
(Figure 184) will appear. To make the adjustment, simply click in the graph
area. The data set will appear immediately so that the effects of dragging the axis
will be evident, allowing the desired display to be achieved in seconds without
need for repeated tries. When working with a high-density data set, only a subset
of the data will be displayed during the adjustment so that the process remains
fast. When the data is displayed as desired, releasing the button will cause the
complete data set to be displayed with the new orientation. Note that you need
not confine the drag operation to the data screen area, and in fact, it may be
necessary to go outside the area to achieve the desired display. Thus reducing the
size of the data window before readjusting the z-axis can make the operation
simpler.
Figure 183. 3D
Layout tab
page.