


120 WinView/32 Manual Version 2.4.M
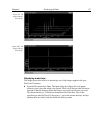
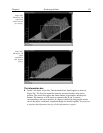
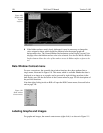
5%-95% display range
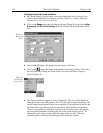
➧ Click the button. The data display will shift so that it only fills the 5% to 95%
region of the window range. Had the data initially extended all the way to the
window boundary, the data display would have been slightly compressed to fit
within the 5%-95% range.
➧ Click on
, restoring the image to its initial appearance.
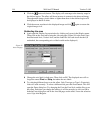
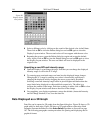
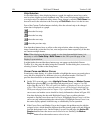
➧ Before advancing to the next topic, open the View menu. Then select the Small
cursor and deselect Cross-Sections.
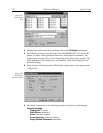
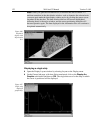
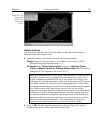
Selecting a region of interest
➧ Using the mouse, drag a rectangular region on the image as shown in Figure 104.
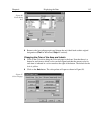
➧ Click the
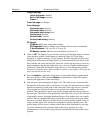
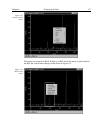
(Zoom In) button. The view will change so that only the selected
region is displayed as shown in Figure 105.
➧ Click the
(Undo All Zoom-In) button. The original view will be restored.
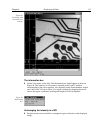
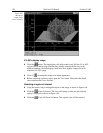
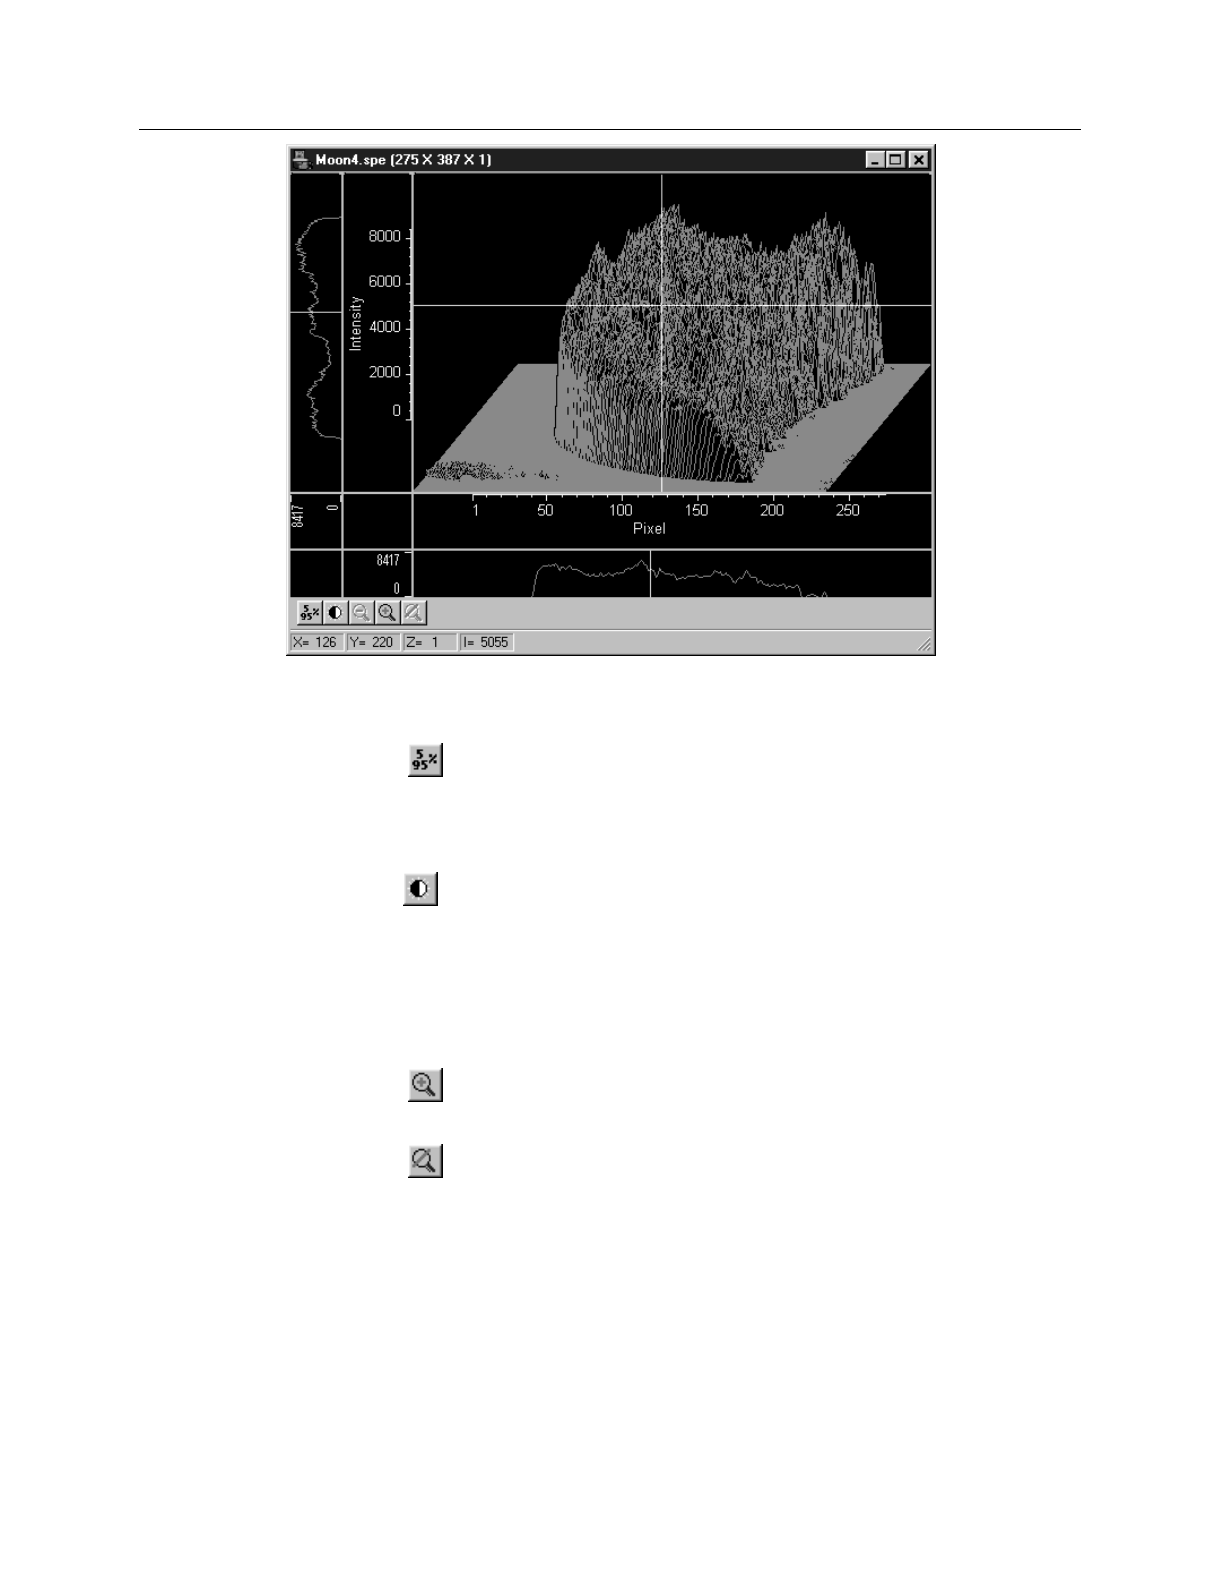
Figure 103.
Moon4.spe
graph, Large
cursor selected.