


Chapter 15 Menus and Dialog Boxes 347
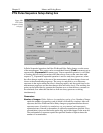
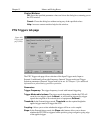
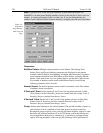
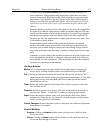
Parameters
Intensity:
If displaying the data as an image, allows you to set the range of data that
will be mapped to the display. Displays generally are capable of displaying 256
(8 bits) gray levels. Depending on the makeup of your particular system and the
experiment, there could be a far larger number of intensities, perhaps thousands,
represented in the data. As a result, actual intensity levels are mapped to the
display so that each display intensity level represents a rather wide range of
actual intensity levels. If you set the number of intensity levels to be mapped to
the display, all pixels of higher intensity will be displayed as white and those of
lower intensity as black. The effect is to increase the contrast over the specified
intensity range.
If displaying the data as a graph with
Initial Autoscale
ON, the intensity axis
is automatically set to a range that allows the full range of intensities to be
shown on opening a new file. You can also set the intensity range manually. As
explained below, this can be particularly advantageous when comparing spectra.
Initial Autoscale:
This checkbox allows Initial Autoscaling to be turned on
and off. The ability to set the intensity range and to turn initial auto-scaling
On and Off can be very helpful in comparing two spectra because it allows
you to set the same intensity scaling for both. For example, suppose you had
two spectra,
A
and
B
that were to be displayed so that they could be
compared. Before loading spectrum
A
, you could go to the Display Layout
Range page and select
Initial Autoscaling
. When spectrum
A
is loaded, an
initial autoscale would occur and the spectrum would be displayed. Suppose
this were done and a cursory examination showed the highest peak to be
~6000. If you knew from experience that the highest intensity in spectrum B
wouldn’t exceed 10,000, you might decide to fix the display range at 0 to
10,000. You would do this by entering “0” in the
From
box and 10000 in
the
To
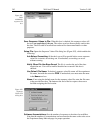
box. You would then deselect
Initial Autoscale
and check
Save
as Default
. Checking Save as Default after deselecting
Initial Autoscale
will “fix” the
Intensity Range
and prevent
Initial Autoscale
from being
switched back on automatically when you close the Range box.
If you turn Initial Autoscale Off and then Save as Default, when you next open a file, the
usual initial autoscale will not occur. If the intensity range of the data in the file is
dramatically different from the Intensity Range settings in effect, the display will appear
abnormal. You might not even be able to see the data at all and conclude that the
software is malfunctioning, when in fact this is not the case.
The next step would be to close the Display Layout window and load
spectrum
B
. Because the intensity range had been fixed at 0 to 10000 for
spectrum
A
, spectrum
B
would be displayed with that same range, allowing
the two displayed spectra to be easily compared. To enhance the comparison
further, you could select
Tile Vertical
on the
Window
menu to display
A
and
B
side-by-side.
Live Auto All Scans:
This special feature allows live data to be displayed so
that each and every scan is separately auto-scaled. It is particularly useful
when focusing or making other adjustments in that the data is always
displayed “on screen.” To see why this is useful, consider the case where
CAUTION