


268 WinView/32 Manual Version 2.4.M
Auto 5%-95%:
Function depends on whether data is being displayed as an image or as
a graph. If displayed as an image, only data in the 5% to 95% range are
displayed. Data with more than 95% of the maximum intensity are displayed as
white, while those with less than 5% of the maximum intensity are displayed as
black. If displayed as a graph, the data intensity scale is shifted so that it begins
at 5% of range above the X axis and ends at 95% of the Y axis. This ensures that
there will be some separation between the data display and the data region
boundaries.
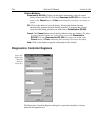
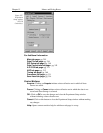
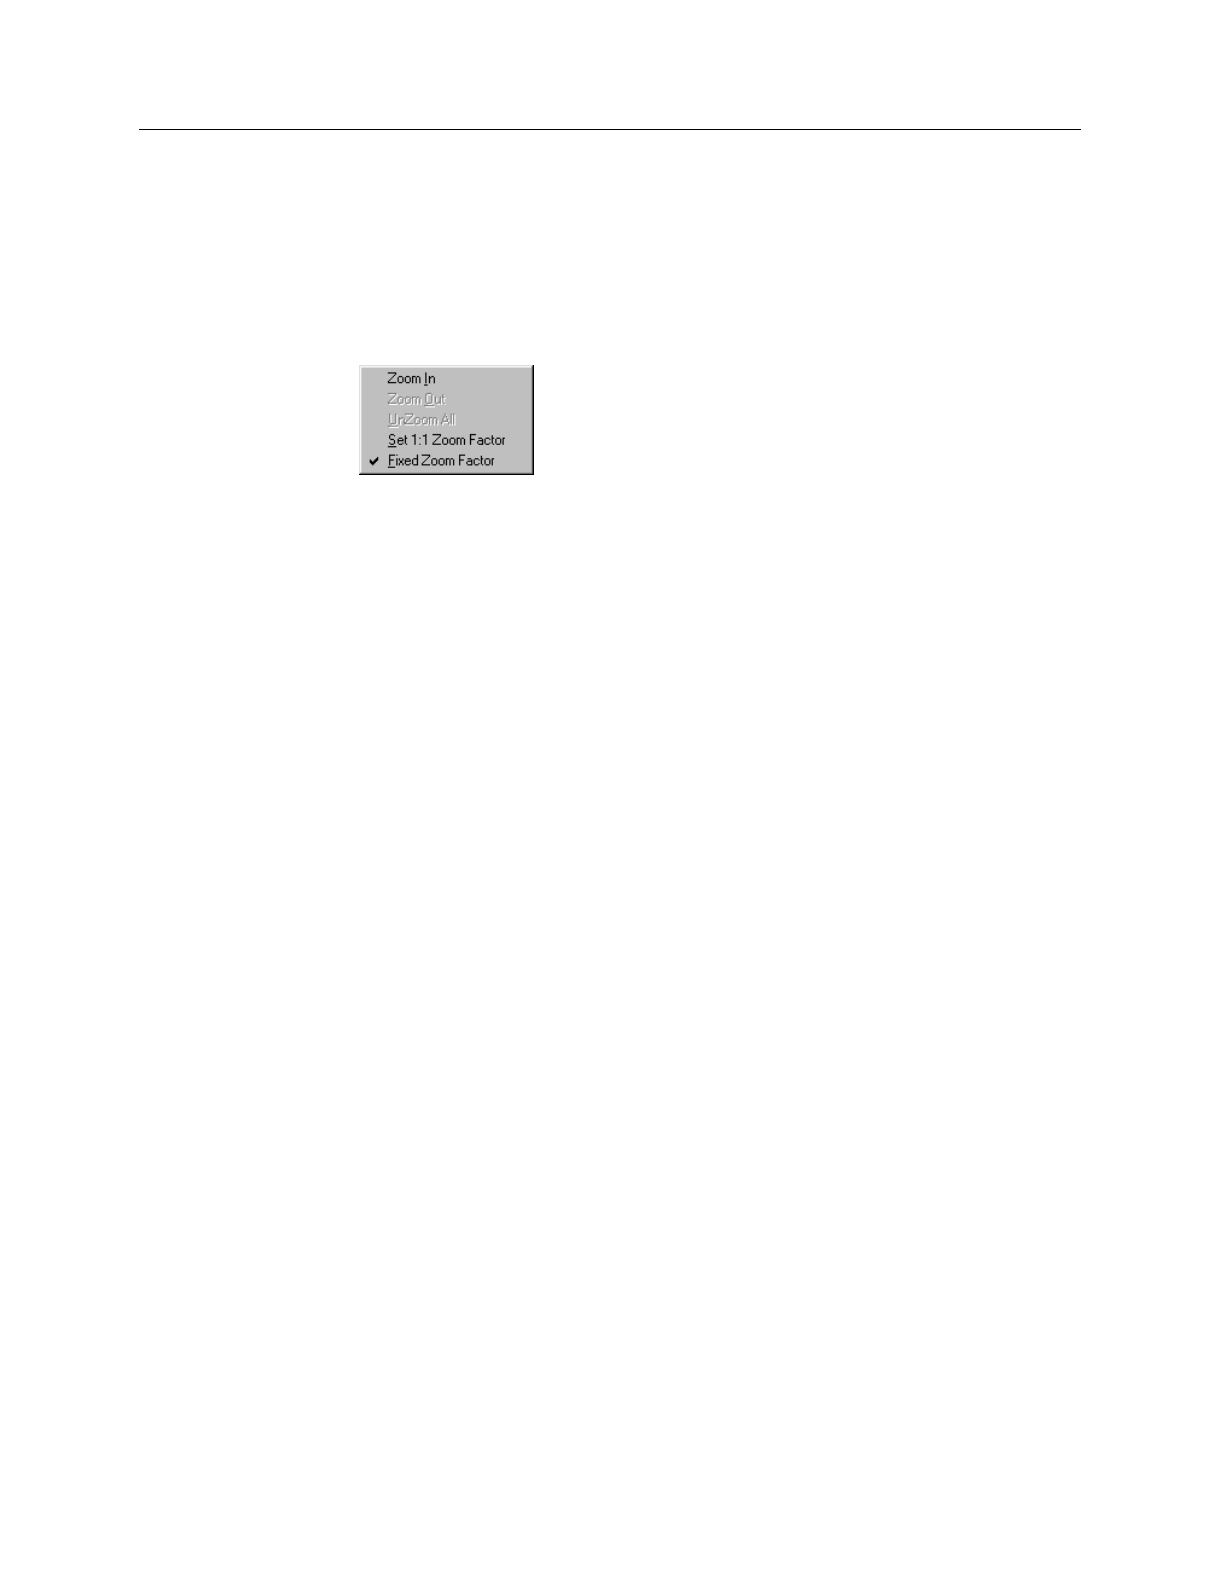
Zoom:
Opens the secondary Zoom menu. Selections are as follows.
Zoom In:
Allows a rectangular region of the displayed data, selected by the
mouse, to expand to fill the display area so that it can be examined in detail.
To select the data, position the mouse cursor at one corner of the region to
be defined. Next press the left mouse button and, while it is held down, drag
the mouse to the diagonally opposite corner of the region being defined.
Then release the mouse button.
Zoom Out:
Zooms out one step if the Zoom In function has been used.
UnZoom All:
Restores the original view if the Zoom In function has been used
repeatedly.
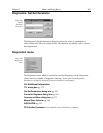
Set 1:1 Zoom Factor:
This selection attempts to set the zoom factor to 1:1. If
the window is in scroll mode, (fixed zoom) this should always succeed,
although you may have to scroll to see the entire image if it is too big to fit
into the app window. If the window is in stretch mode (variable zoom) then
it may be impossible to set the zoom to 1:1 if this would make the window
too big to fit into the application window. In this case the zoom factor is set
as close to 1:1 as possible. The Zoom 1:1 button will be in the pressed
position as long as the zoom factor is 1:1, whether this happens as a result of
clicking the button or setting the zoom factor some other way.
Fixed Zoom Factor:
When selected, the mapping of image pixels to the
monitor cannot be changed. As a result, the image size remains constant,
although the window size can be adjusted by dragging the window’s corner
or an edge. Scrollbars allow all portions of the image to be viewed.
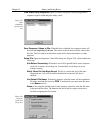
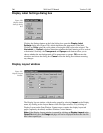
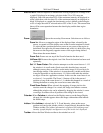
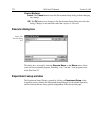
Colorbar:
When
Colorbar
is selected on the Display menu or on the Image Display
tab page, the colorbar appears above the image with numbers that indicate
the actual range.
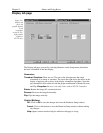
Infobar:
When
Infobar
is selected, the X, Y, Z and Intensity values at the cursor
position are listed on the infobar, which is located directly beneath the Data
Window toolbar. The infobar information is displayed for both image and
intensity (graph) displays and appears even if the cursor isn’t displayed.
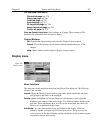
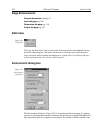
Toolbar:
Allows the Data Window toolbar to be switched on or off.