


Chapter 15 Menus and Dialog Boxes 251
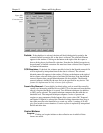
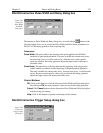
Cursor:
Equivalent to selecting the Cursor on the View menu; gives choice
of
small
,
large
, or
no cursor
. The crosshair (large) cursor can be particularly
useful, for example, if the scale function is active. The precise pixel position of
the cursor can be read from the scales using the crosshair.
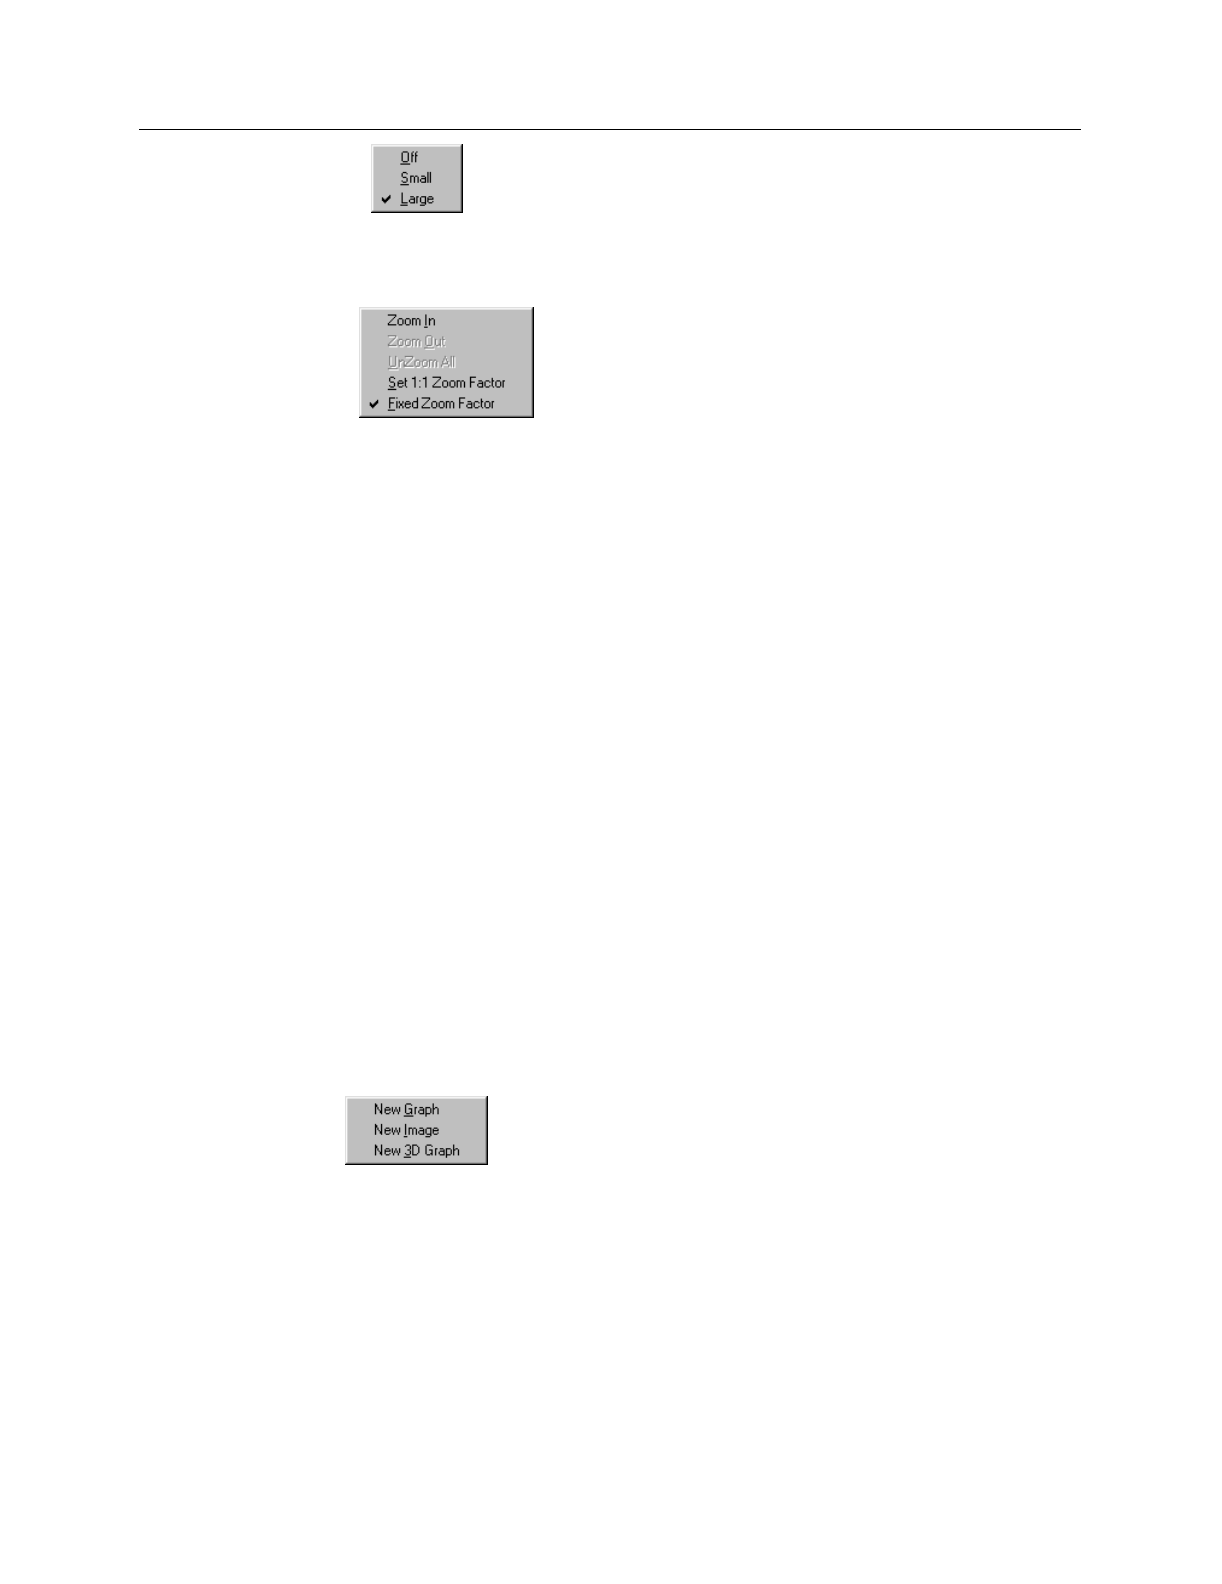
Zoom:
Provides the same zoom functions as are present on the data
screen toolbar. They are:
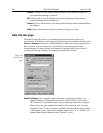
Zoom In:
Allows a rectangular region of the displayed data, selected by the
mouse, to expand to fill the display area so that it can be examined in detail.
To select the data, position the mouse cursor at one corner of the region to
be defined. Next press the left mouse button and, while it is held down, drag
the mouse to the diagonally opposite corner of the region being defined.
Then release the mouse button.
Zoom Out:
Zooms out one step.
UnZoom All:
Restores the original view if the Zoom In function has been used
repeatedly.
Set 1:1 Zoom Factor:
This selection attempts to set the zoom factor to 1:1. If
the window is in scroll mode, (fixed zoom) this should always succeed,
although you may have to scroll to see the entire image if it is too big to fit
into the app window. If the window is in stretch mode (variable zoom) then
it may be impossible to set the zoom to 1:1 if this would make the window
too big to fit into the application window. In this case the zoom factor is set
as close to 1:1 as possible. The Zoom 1:1 button will be in the pressed
position as long as the zoom factor is 1:1, whether this happens as a result of
clicking the button or setting the zoom factor some other way.
Fixed Zoom Factor:
When selected, the mapping of image pixels to the
monitor cannot be changed. As a result, the image size remains constant,
although the window size can be adjusted by dragging the window’s corner
or an edge. Scrollbars allow all portions of the image to be viewed.
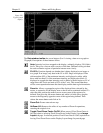
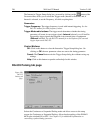
New:
If a data file is open and active, selecting New Graph, New Image
or New 3D Graph will cause a second window containing the selected data to be
displayed in the selected format.
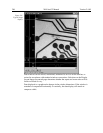
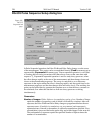
Colorbar:
Causes a colorbar containing the image colors to appear above the image
with numbers that indicate the actual data range. The Colorbar is only available
when viewing an image.
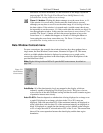
Infobar:
Causes the X, Y, Z and Intensity values at the cursor position to be listed on
the Information Bar, which is located directly beneath the Data Window button
bar. The infobar information is displayed for both image and intensity (graph)
displays and appears even if the cursor isn’t displayed.