


Chapter 15 Menus and Dialog Boxes 235
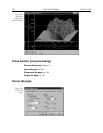
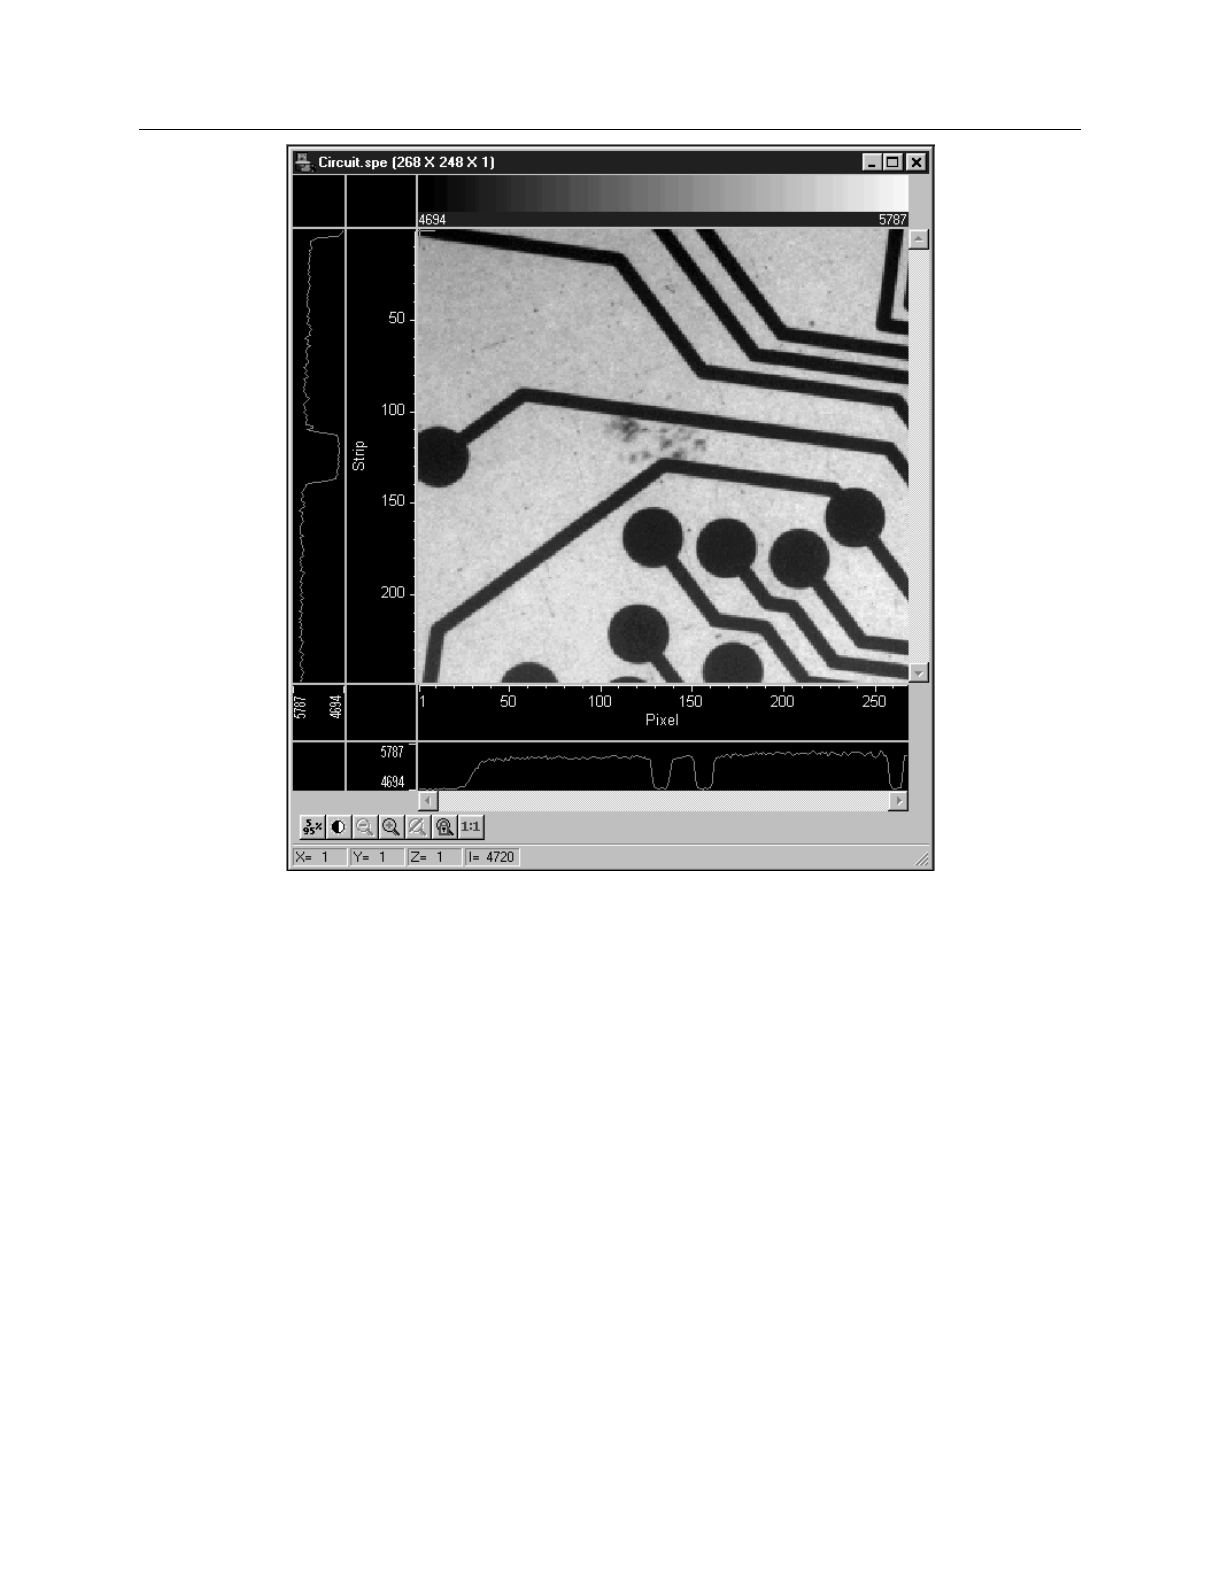
Figure 207 shows cross-sectional profiles with a 3D Graph. The vertical cross-section
profiles the intensity at the same point on each successive strip. The horizontal cross-
section profiles the intensity at each point on the same strip. If the large cursor is
selected, cursor projections will intersect the cross section to indicate the cursor position.
These projections may not be visually aligned with the cursor position on the main plot.
This effect will be particularly noticeable with a long Z axis. Because of perspective
effects, the higher numbered strips will be further away and visually smaller. The axes
automatically adjust so that they read true for the strip on which the cursor is located.
However, because the cross-section profiles expand to use all of the available space, they
will not be in alignment visually with the cursor. The profile shapes will be correct, and
the point on the profiles intersected by the large cross-hair extensions will accurately
indicate the cursor position. Also, the information box will accurately report the pixel
number and intensity at the cursor position.
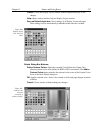
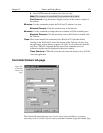
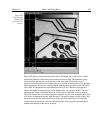
Figure 206.
Typical image
display with
axes and cross-
sections.