


Chapter 6 Displaying the Data 109
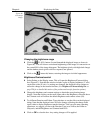
Changing the brightness range
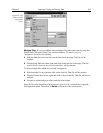
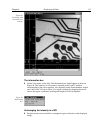
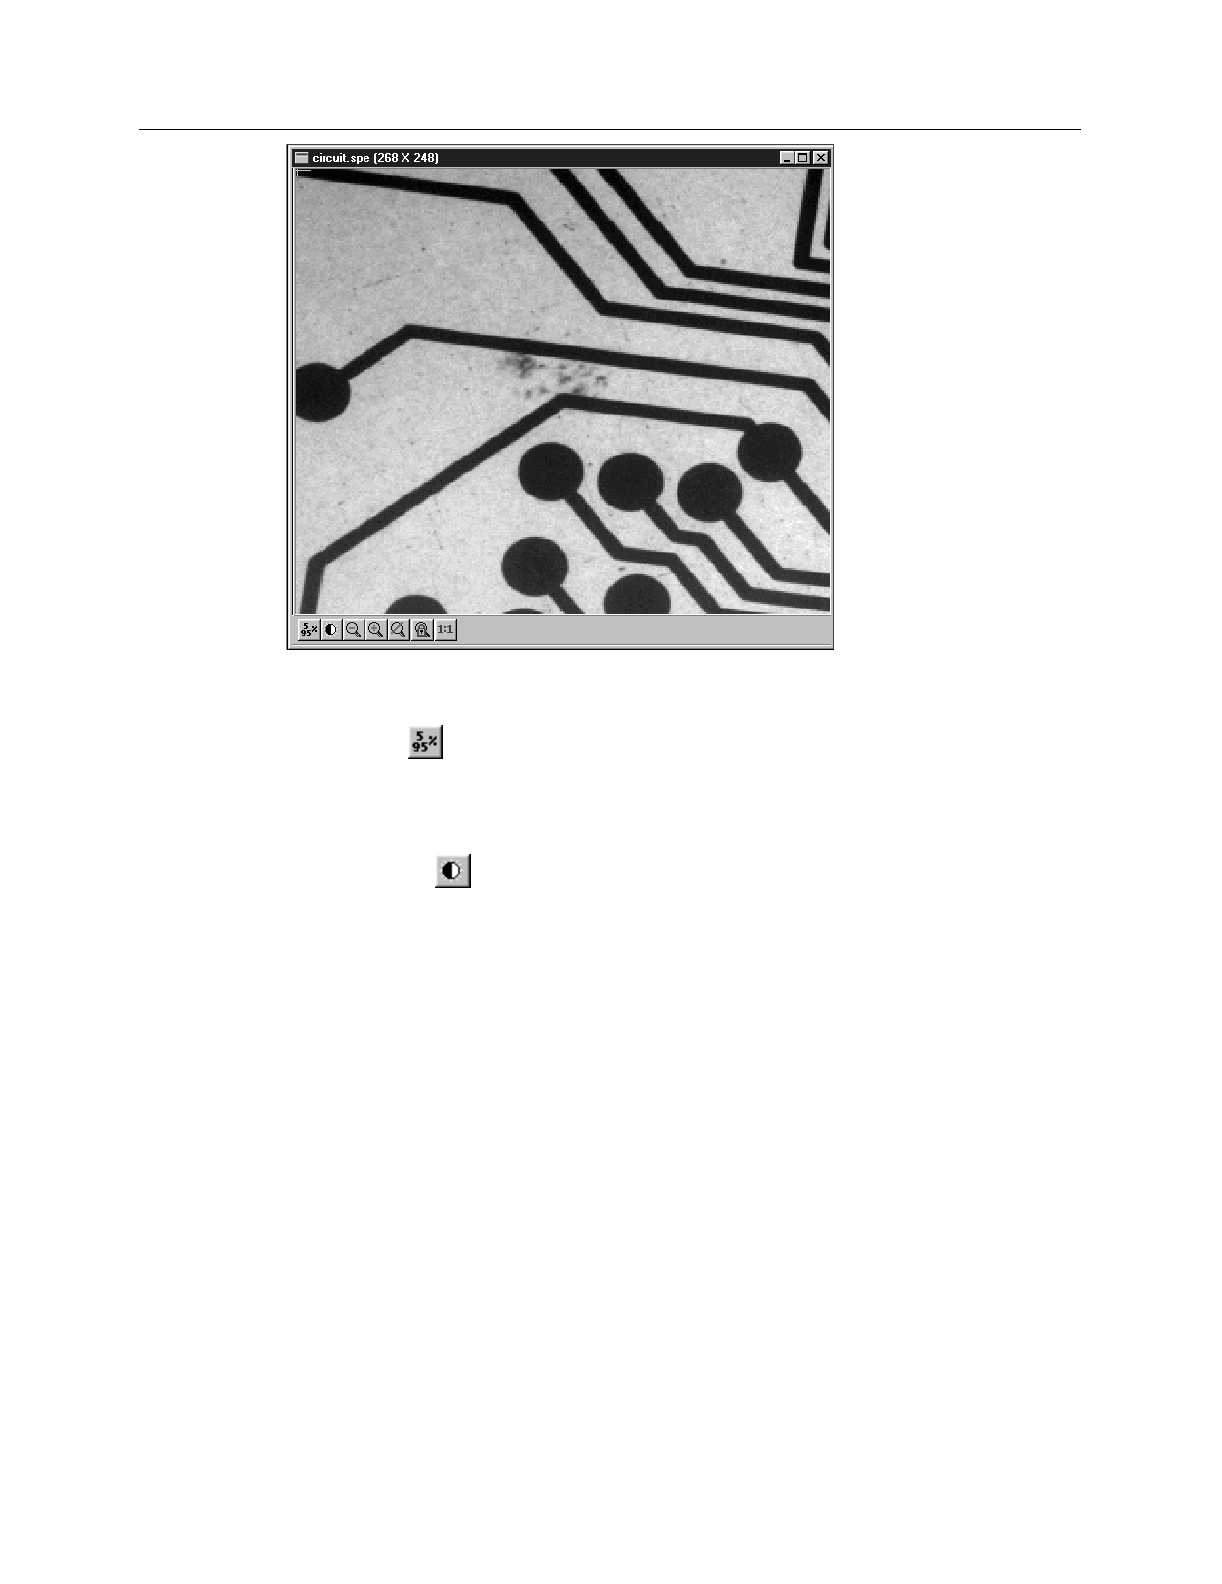
➧ Click the (5%-95%) button (located beneath the displayed image as shown in
Figure 86). You will observe a moderate brightening of the image as it autoscales on
the central 90% of the image histogram. The brightest (pixels with high dark charge)
and the darkest pixels (pixels with low response) are ignored.
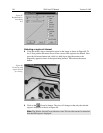
➧ Click on the
(Autoscale) button, restoring the image to its initial appearance.
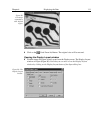
Brightness/Contrast control
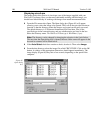
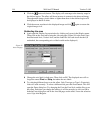
➧ Select Palette on the Display menu. This will open the Brightness/Contrast dialog
box (Figure 87). Note that the window includes a plot of display brightness (Y axis)
versus data value (X axis). As settings are changed, the displayed curve changes to
reflect the change in the transfer function. (See
Brightness/Contrast dialog box
on
page 220 for a detailed discussion of the palette and transfer function options.)
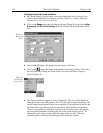
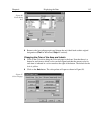
➧ Change the brightness and contrast settings to obtain the most pleasing image
display. Note that clicking on the small square above the Brightness scale and above
the Contrast scale will restore the default brightness and contrast values (50).
➧ Try different Function and Palette Type selections to see the effect on the displayed
image. Note that the displayed curve will also change, reflecting the change in the
signal value to display brightness transfer function. Until you gain more operating
experience, we suggest you leave the Function Type set to Linear, the Palette to
Grayscale, and the Brightness and Contrast both to 50.
➧ Click on
OK
to close the box. Any setting changes will be applied.
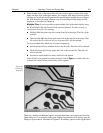
Figure 86.
Circuit.spe
image.