


174 WinView/32 Manual Version 2.4.M
Histogram Calculation
Introduction
Two types of histograms are available for graphing the distribution of intensities of an
image. The
Histogram
operation groups pixels of a similar intensity together. The X-
axis indicates the intensity, and the Y-axis displays the number of pixels in that intensity
range.
The
Cumulative Histogram
operation groups pixels of a similar intensity together,
once again using the X-axis to show intensity. This time, however, the Y-axis indicates
the total number of pixels with intensity less than or equal to the range. Thus the
Cumulative Histogram is always an increasing function.
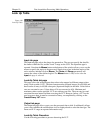
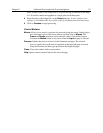
Procedure
➧ Select
Histogram
from the Process menu.
➧ On the
Input
tab page, if the correct input image does not appear in the Input Image
box, enter the complete file name or search for a file using the browser, accessed by
the button to the right of the text box.
➧ On the
Input
tab page, select the data frame containing the data on which the
operation is to be performed.
➧ If you wish to process only part of the Input Image, enter the appropriate X-Y range
values. Alternatively specify a data region in the active window using the mouse and
click the
Mouse
button at the bottom of the window to enter those values.
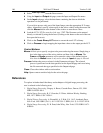
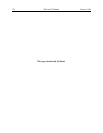
➧ On the
Parameters
tab page, select either
Histogram
or
Cumulative
Histogram
, whichever is wanted.
➧ On the Parameters tab page, under
Values
, enter the
Low Intensity
and
High
Intensity
values. These are the Y-Max and Y-min. Then enter the
Group Size
,
which is the range of intensity that the software will group together as a single data
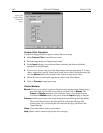
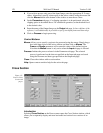
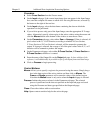
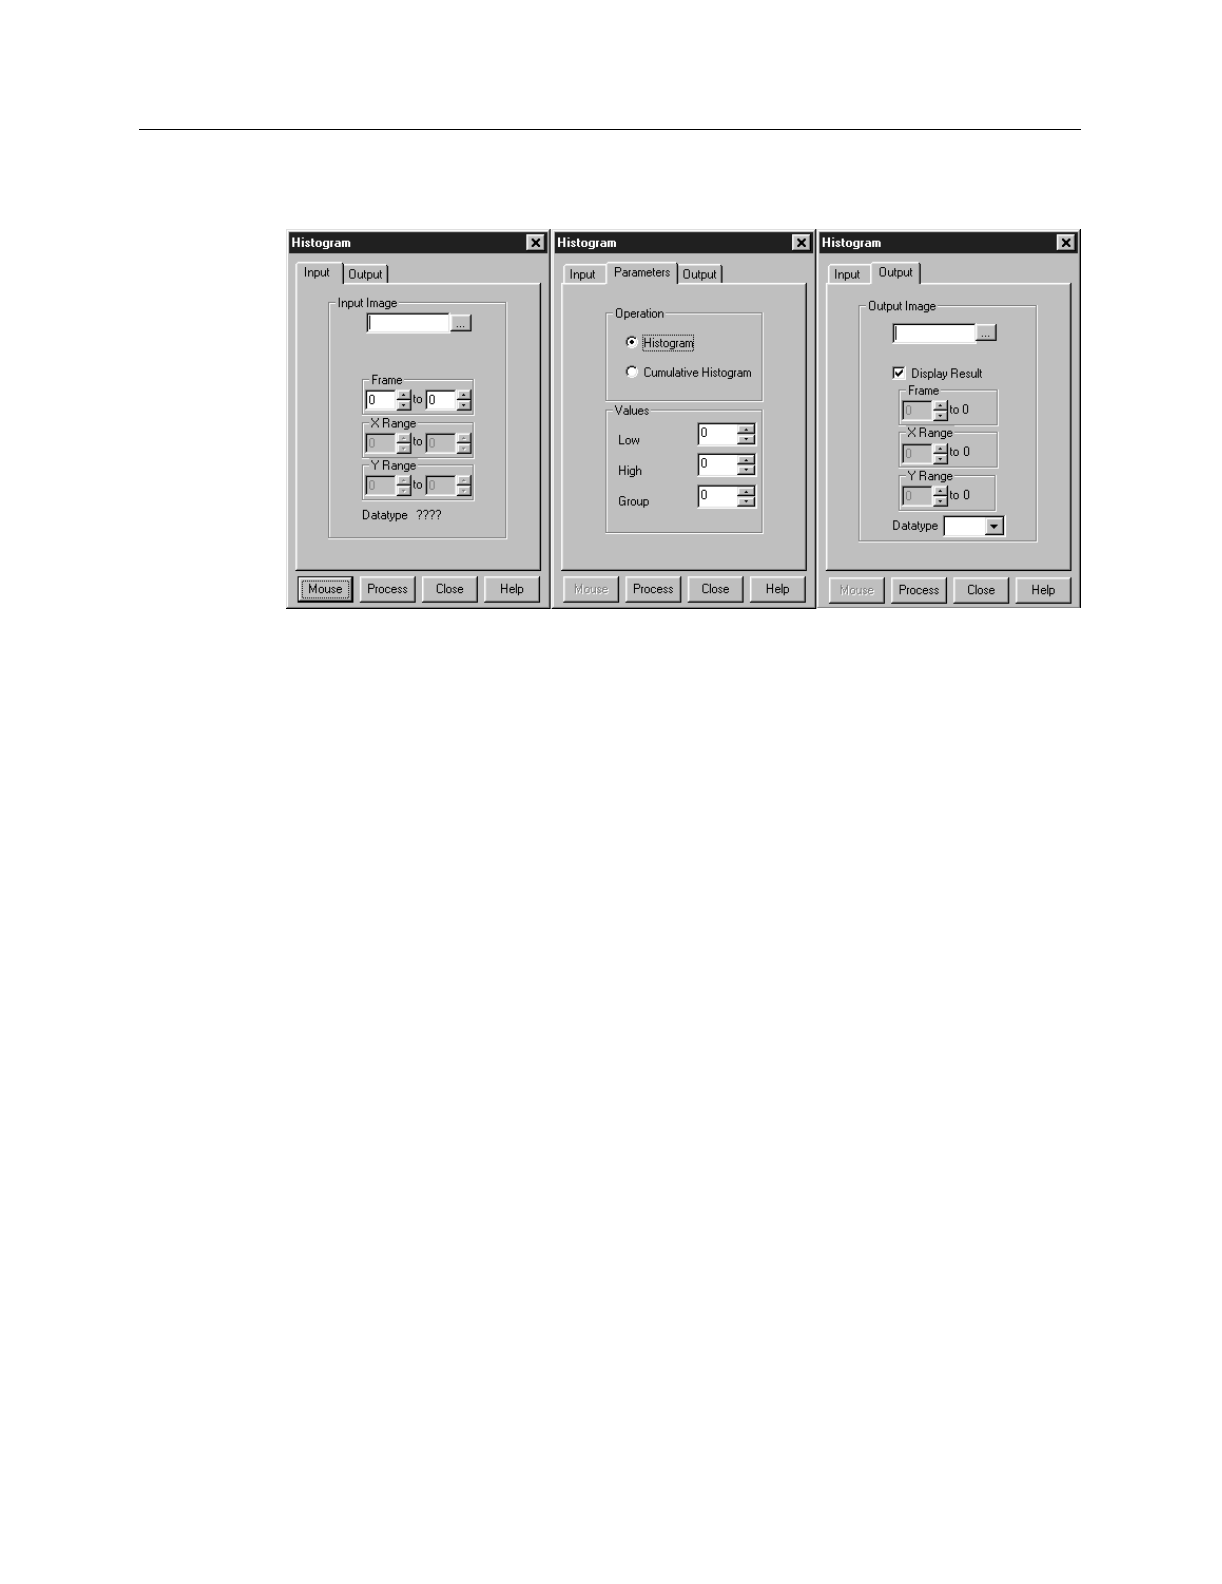
Figure 153.
Postprocessing
Histogram tab
pages.