


Chapter 15 Menus and Dialog Boxes 311
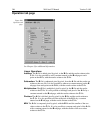
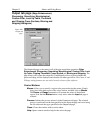
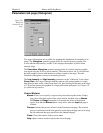
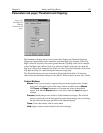
Parameters tab page (Histogram)
Two types of histograms are available for graphing the distribution of intensities of an
image. The
Histogram
operation groups pixels of a similar intensity together. The
X-axis indicates the intensity, and the Y-axis displays the number of pixels in that
intensity range.
The
Cumulative Histogram
operation groups pixels of a similar intensity together,
once again using the X-axis to show intensity. This time, however, the Y-axis indicates
the total number of pixels with intensity less than or equal to the range. Thus the
Cumulative Histogram is always an increasing function.
The
Low Intensity
and
High Intensity
parameters set the Y-Max and Y-min values.
Group Size
is the range of intensity that the software will group together as a single
data point. In other words, if the Group Size is 50, pixels having an intensity in the range
of 1-50 will be counted and graphed as a single point on the histogram. See Chapter 10
for additional information.
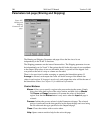
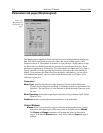
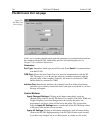
Control Buttons:
Mouse:
Allows you to specify a region to be processed using the mouse. Simply
drag a box in the data region of the active window and then click on
Mouse
.
The
Frame
and
Range
parameters will assume the values of the defined
region. Note that the
Mouse
button is only active when the
Input
tab page is
selected.
Process:
Initiates the process selected via the Parameters tab page. The selected
process is performed on the data specified on the Input tab page and saved using
the file name and data type specified on the Output tab page.
Close:
Closes the window with no action taken.
Help:
Opens context-sensitive help for the active tab page.
Figure 270.
Histogram
Parameters tab
page.