


250 WinView/32 Manual Version 2.4.M
unselected. For more information, see the discussion of the Image Layout tab
page on page 283. The Toggle Fixed Zoom Factor On/Off button is only
provided when viewing a data set as an image.
Zoom 1:1 button:
Clicking this button attempts to set the zoom factor to 1:1.
If the window is in scroll mode, (fixed zoom) this should always succeed,
although you may have to scroll to see the entire image if it is too big to fit into
the data window. If the window is in stretch mode (variable zoom) then it may
be impossible to set the zoom to 1:1 if this would make the window too big to fit
into the application window. In this case the zoom factor is set as close to 1:1 as
possible. The Zoom 1:1 button will be in the pressed position as long as the
zoom factor is 1:1, whether this happens as a result of clicking the button or
from setting the zoom factor some other way. The Zoom 1:1 button is only
provided when viewing a data set as an image.
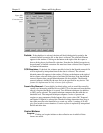
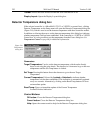
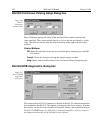
Data Window Context menu
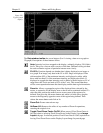
For user convenience, the essential data window functions have been gathered into a
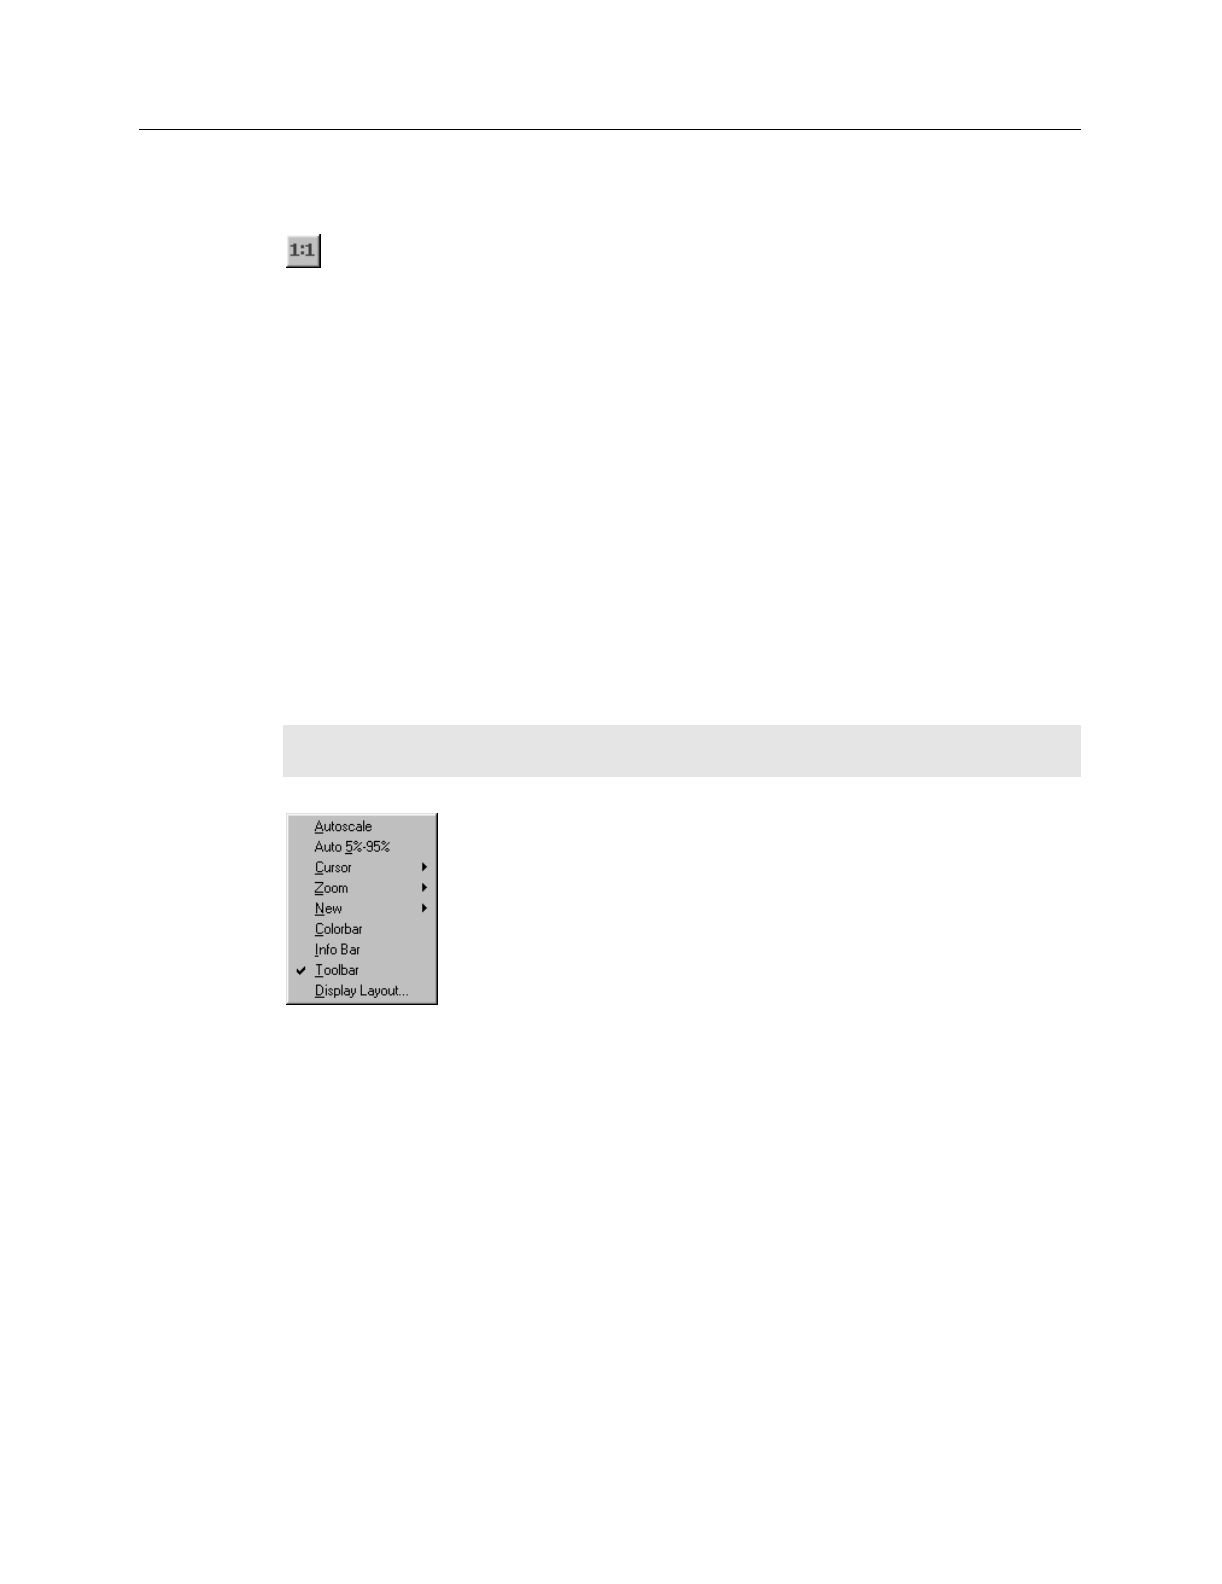
single menu, the Data Window Context menu, illustrated in Figure 110. This menu,
which is available whether the data is displayed as an image or as a graph, can be
accessed by right clicking anywhere in the data display area. Brief descriptions of the
provided functions follow.
Note:
Right clicking inside an ROI will open the ROI context menu, described on
page 349.
AutoScale:
All of the data intensity levels are mapped to the display, which are
ordinarily capable of displaying 256 (8 bits) gray levels. This gives a fast on-
scale overview of the data. Different scaling can then be used to examine regions
of particular interest more closely.
Auto 5%-95%:
Function depends on whether data is being displayed as an image or as
a graph. If displayed as an image, only data in the 5% to 95% range are
displayed. Data with more than 95% of the maximum intensity are displayed as
white, while those with less than 5% of the maximum intensity are displayed as
black. If displayed as a graph, the data intensity scale is shifted so that it begins
at 5% of range above the X axis and ends at 95% of the Y axis. This ensures that
there will be some separation between the data display and the data region
boundaries.
Figure 213.
Data Window
Context menu.