


4-27
User Guide for the CiscoWorks 1105 Wireless LAN Solution Engine
78-14092-01
Chapter 4 Using Reports
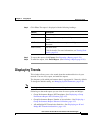
Displaying Trends
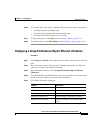
Displaying an AP and Bridge Performance: Tabular
Procedure
Step 1 Select Reports > Trends. The window refreshes with a device selector in the left
pane.
Step 2 From the device selector in the left pane, click to expand the folder you want to
view. The right pane refreshes.
Step 3 From the Report Name list, select AP and Bridge Performance: Tabular.
Step 4 From the Start Date list, select the start date for the graph, an d from the For a
period of list, select the number of days.
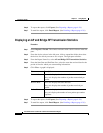
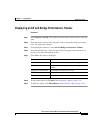
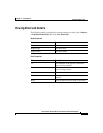
Step 5 Click View. The report is displayed:
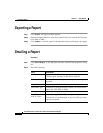
Step 6 To export the report, click Export. (See Exporting a Report, page 4-28.)
Step 7 To email the report, click Email Report. (See Emailing a Report, page 4-28.)
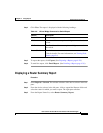
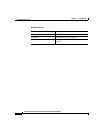
Column Description
IP Address The IP address of the access point or bridge.
Timestamp The time the access point was last seen by the
system.
Number of Associations The number of client associations.
RF Utilization The amount of radio frequency utilization.
Ethernet Utilization The amount of Ethernet utilization.