


Chapter 4 Using Reports
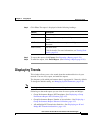
Displaying Trends
4-26
User Guide for the CiscoWorks 1105 Wireless LAN Solution Engine
78-14092-01
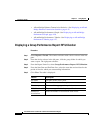
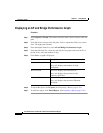
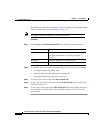
Displaying an AP and Bridge Performance: Graph
Procedure
Step 1 Select Reports > Trends. The window refreshes with a device selector in the left
pane.
Step 2 From the device selector in the left pane, click to expand the folder you want to
view. The right pane refreshes.
Step 3 From the Report Name list, select AP and Bridge Performance Graph.
Step 4 From the Start Date list, select the start date for the graph, an d from the For a
period of list, select the number of days.
Step 5 Click View. A graph is displayed:
Step 6 To export the report, click Export. (See Exporting a Report, page 4-28.)
Step 7 To email the report, click Email Report. (See Emailing a Report, page 4-28.)
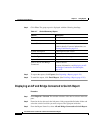
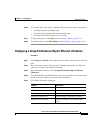
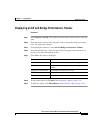
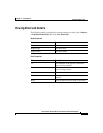
Column Description
Number of Associations The x-axis displays the time intervals.
The y-axis displays the number of client
associations
RF Utilization The x-axis displays the time intervals.
The y-axis displays the percent of radio
frequency utilization.
Ethernet Utilization The x-axis displays the time intervals.
The y-axis displays the percent of Ethernet
utilization.