DeLorme Topo North America Help
215
Viewing the Profile Elevation Graphs
The Profile tab lets you view two profile elevation graphs; the profile graph and the
overview profile graph.
To View the Profile Graph
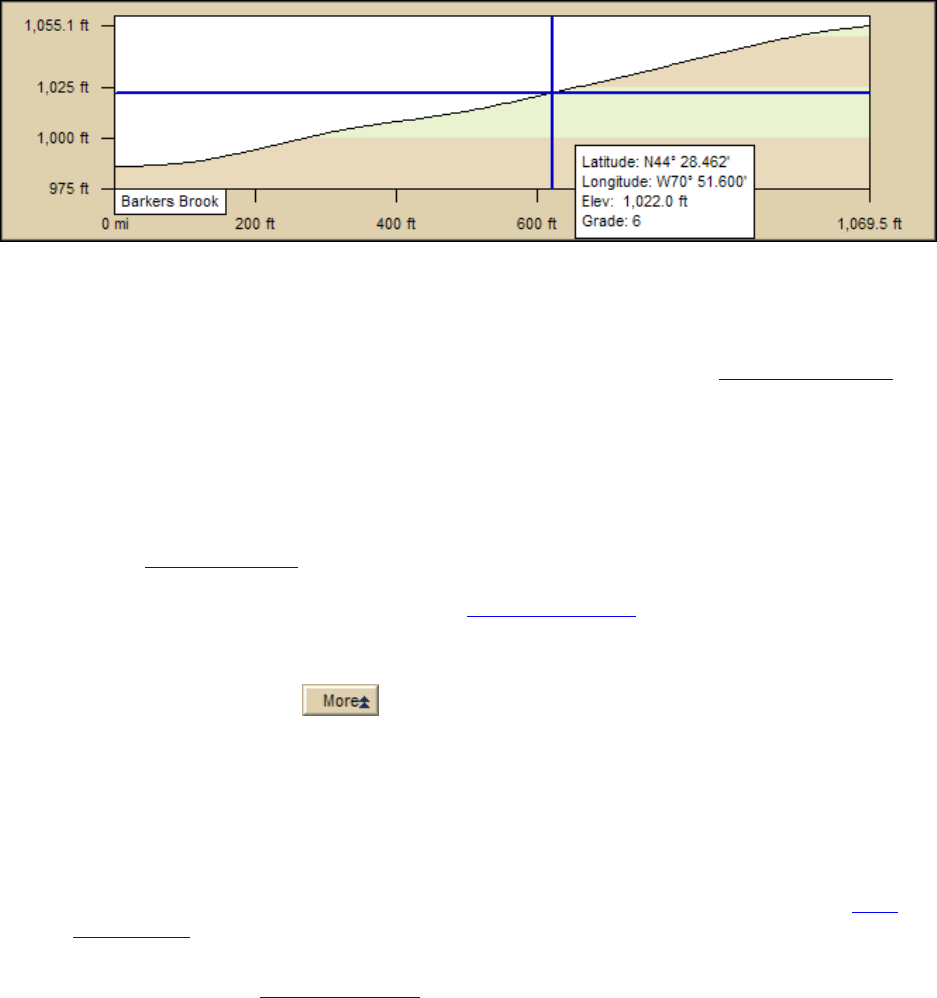
The profile graph automatically displays when you select an object to profile. It shows a
two-dimensional image of the elevation associated with the selected object. Distance and
elevation are indicated below and to the left of the graph respectively.
Use the following steps to view a profile graph.
1. Create a profile of an object or route. For more information see Creating a Profile
.
2. Move your cursor along the elevation profile in the profile graph.
• The intersection of the vertical and horizontal blue lines travels along the top
of the terrain profile. These lines indicate the height and distance of the
particular location as you move along the graph.
• As you move your cursor along the graph, an info box provides statistical data
about the profile, such as coordinates, elevation, grade, and so on. See
Statistical Data
for more information about this data. If you downloaded an
object with supported profile data, the info box may also include additional
data (for example, speed). See User Profile Data
for more information.
• As you move your cursor along the profile graph, a small crosshair follows
along the corresponding object on the map.
3. Click the More button
near the bottom of the tab area to expand the view.
4. Optional To generate a profile from a route you have created, select the Show Text
check box to view route numbers, road names, waypoint numbers, and their
associated waypoint names.
Notes The route displays in the profile graph with small markers indicating the start
and finish for the route as well as any waypoints it contains.
5. Optional If the profile object contains additional supported data, such as that
downloaded from an athletic device, a toolbar appears above the graph. See User
Profile Data for more information about viewing and managing this data.
6. View the current statistical information options you have selected to the right of the
profile graph. See Statistical Data
for more information about adding, removing, and
