


4-53190-01102-02 Rev. B
Garmin G500 Pilot’s Guide
Foreword
Sec 1
System
Sec 2
PFD
Sec 3
MFD
Sec 4
Hazard
Avoidance
Sec 5
Additional
Features
Sec 6
Annun.
& Alerts
Sec 7
Symbols
Sec 8
Glossary Appendix A
Appendix B
Index
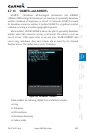
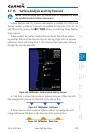
4.7.15 Surface Analysis and City Forecast
NOTE: Surface Analysis and City Forecast data are displayed only within
the installed Aviation Database service area.
Surface Analysis and City Forecast information is available for current and
forecast weather conditions. Forecasts are available for intervals of 12, 24, 36,
and 48 hours by pressing the SRFC TIME soft key or in the Page Menu Weather
Setup options.
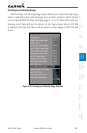
When enabled, the Surface Analysis forecast shows frontal lines indicat-
ing weather fronts and the direction they are moving. High and Low pressure
centers are noted with a large H or L. The Forecast Time menu item will step
through the intervals manually.
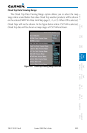
Figure 4-40 XM Weather - Surface Analysis and City Forecast
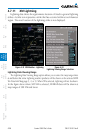
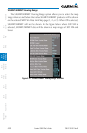
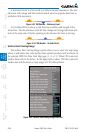
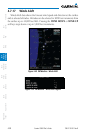
A Cold Front is a front where cold air replaces warm air. A blue line with
blue triangles that point in the direction of the cold air flow.
Figure 4-41 XM Weather - Cold Front
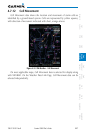
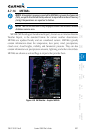
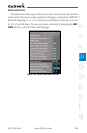
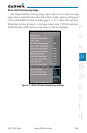
A Warm Front is where warm air replaces cold air. An orange line with
orange half moons that point in the direction of the warm air flow.
Figure 4-42 XM Weather - Warm Front