


5-6
hsb
2
PLUS Series LCD Display
Displaying Object
Information
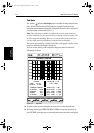
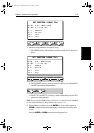
Tide Data
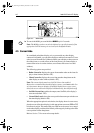
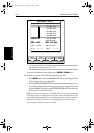
The symbol indicates tide height data is available for that position on the
chart. When you select the tide height option, a graph of predictions for
maximum and minimum tide heights is displayed, data for sunrise and sunset
is also provided as illustrated Figure 5-3.
Note: The predictions available are sufficiently accurate under moderate
weather conditions, for the coastal areas served by the reference station, to be
used for navigation planning. However, certain weather fronts and storms
can alter tidal patterns and influence predicted times and heights.
The cursor, represented by a dotted vertical line on the graph, is used to select
a time for which the tide height is displayed.
You can use the soft keys and trackpad to change the date for which tide
information is shown.
Figure 5-3: Tide Data
➤
To select a time, use the trackpad to move the cursor to the required time.
➤ To change the day press PREV. DAY, DAY or TODAY, as required. Alternatively,
press
SET DATE; to change date, use the trackpad to move the cursor left/right to
PREV. DAY TODAY
SET DATE
NEXT DAY
SUNRISE/SUNSET
TWILIGHT 0646
SUNRISE 0807
SUNSET 1611
TWILIGHT 1732
CURSOR
0 2 4 6 8 1012141618202224
TIME 13:30
HEIGHT 4.06m
SELECTED DATE
2/01/1998
CSR 50°49^05W BRG 304°T
POS 001°18^00W RNG 27.70nm
HIGH/LOW WATER
HIGH 0220 4.22m
LOW 0640 0.88m
HIGH 1400 4.10m
LOW 1900 0.76m
0.71
1.36
2.01
2.66
3.31
3.96
4.61
CALSHOT CASTLE
6nm
D4270-1
81186_2.book Page 6 Monday, December 17, 2001 8:35 AM