


S1400CW Page 4-2 Section 4 - Lightning & Surge
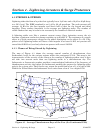
Thunderstorms are cloud formations that produce lightning strikes (or strokes). Across the
United States there is an average of 30 thunderstorm days per year. Any given storm may
produce from one to several strokes. Data on the subject indicates that for an average area
within the United States there can be eight to eleven strokes to each square mile per year.
The risk of stroke activity is increased for various areas such central Florida where up to 38
strokes to each square mile per year are likely to occur.
To determine the probability of a given structure (tower, building, etc.) (within your
location) being struck, perform the following computation:
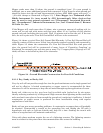
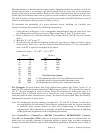
1. Using the map of Figure 4-1 (or a comparable meteorological map for your local), find
the Isokeraunic level (I) for your area. Then using Chart 1, find “A” for your area.
2. Refer to Figure 4-1 to find the latitude. Then using Chart 2, find “B” for your latitude
(Lat.°).
3. Multiply “A” x “B” to get “C”.
4. To calculate the number of lightning strikes per year that are likely to strike a given
object (tower, mast, etc.), use the equation that follows (where “C” was calculated in
step 3 and “H” is equal to the height of the object.
Strikes Per Year = (“C” x H
2
) ÷ (.57 x 10
6
)
Chart 1 Chart 2
I “A”
LAT.° “B”
5 8 25 .170
10 26 30 .200
20 85 35 .236
30 169 40 .280
40 275 45 .325
50 402
60 548
70 712 Note for these charts:
80 893 I = Thunderstorm Days Per Year (Isokeraunic Number)
90 1069 A = Stroke activity for associated Isokeraunic Area
100 1306 B = Height/Stroke coefficient for associated latitude
For Example: On Long Island, New York (Isokeraunic number 20), Chart 1 gives “A” to
equal 85. The latitude is approximately 40°. Referring to Chart 2, “B” is found to be equal to
.28. “C” for this example is equal to 23.80. Using the equation for strikes per year, it is
determined that a 100-foot tower has .4 chances per year of being struck by lightning.
Assuming that no other structures are nearby, the tower will more than likely be struck by
lightning at least once in three years.
Note: The Isokeraunic activity numbers connoted as I, “A” and “B” in Charts 1 and 2 above
are provided for the continental United States. Isokeraunic data for various countries
is available from various federal or state Civil Engineering or Meterorelogical
organizations. This information is typically available from manufacturers of lightning
strike protection equipment (such as Lightning Arresters).
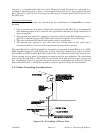
Since ControlWave, ControlWave MICRO, ControlWave EFM/GFC/XFC, Control-
WaveLP and ControlWaveEXP units are dc operated systems that are isolated from AC
grids, they are typically immune to lightning strikes to power lines or power equipment
(except for inductive flashover due to close installation proximity). However, once a radio or