


Appendix C
Page 125
Programming Features
LCD Test
Display Test verifies all the pixels in the Liquid Crystal Display (LCD) are
functional. The LCD is made up of 14,400 pixels that are turned on and off as
needed to create the display of graphics and text. Each individual pixel is
turned on and off by its own transistor. If a transistor fails, the pixel will not turn
on, potentially causing an unreadable or confusing display.
Select
LCD TEST from the Diagnostics Menu. The display will become black
for 3 seconds. To verify that all pixels are functional. A defective pixel will
stand out as a white dot in the field of black dots. A message, “THE DISPLAY
WILL REMAIN INVERTED FOR 3 SECONDS” is shown for 2 seconds
followed by a 3-second period with all dots turned on.
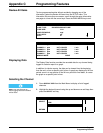
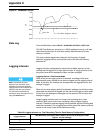
Demonstration Graph
The demonstration graph provides a small portion of demonstration data to
use when learning how to use the graphing screen for the first time or for
training others on its operation. No data logging is required to use the
demonstration graph.
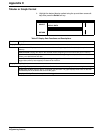
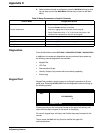
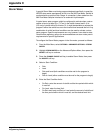
Velocity Analysis
A velocity sensor must be installed in the flow stream and must be connected
to the meter in order for this diagnostic to work. This diagnostic allows the
viewing of ‘real time’ readings directly from the Submerged Area/Velocity
Sensor. It shows the current velocity Signal Strength (percentage of Doppler
signal returning to the sensor) and a ‘real time’ velocity measurement of the
flow stream. Use this diagnostic to determine that the sensor is mounted for
optimal velocity measurement. The closer to 100% the Signal Strength is, the
more stable the velocity reading will be. If the signal seems low (50% or less),
it may be due to improper installation of the sensor or a lack of particulate in
the flow stream.
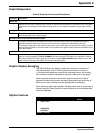
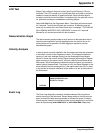
Event Log
The Event Log diagnostic provides a time/date stamped list of significant
events occurring in the flow meter. Review these events to find out when an
event occurred and what events preceded or followed the event of interest.
Events may be viewed in chronological order from the beginning or end of the
event list by selecting
VIEW FROM START or VIEW FROM END respectively.
11:00 AM 21 - APR - 01 VELOCITY ANALYSIS
SIGNAL STRENGTH: 90%
VELOCITY: 7.00 fps
RETURN