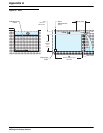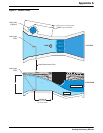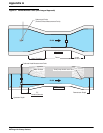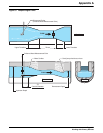
Page 118
Programming Features
Appendix C
Tabular or Graph Format
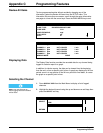
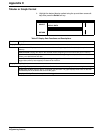
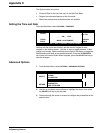
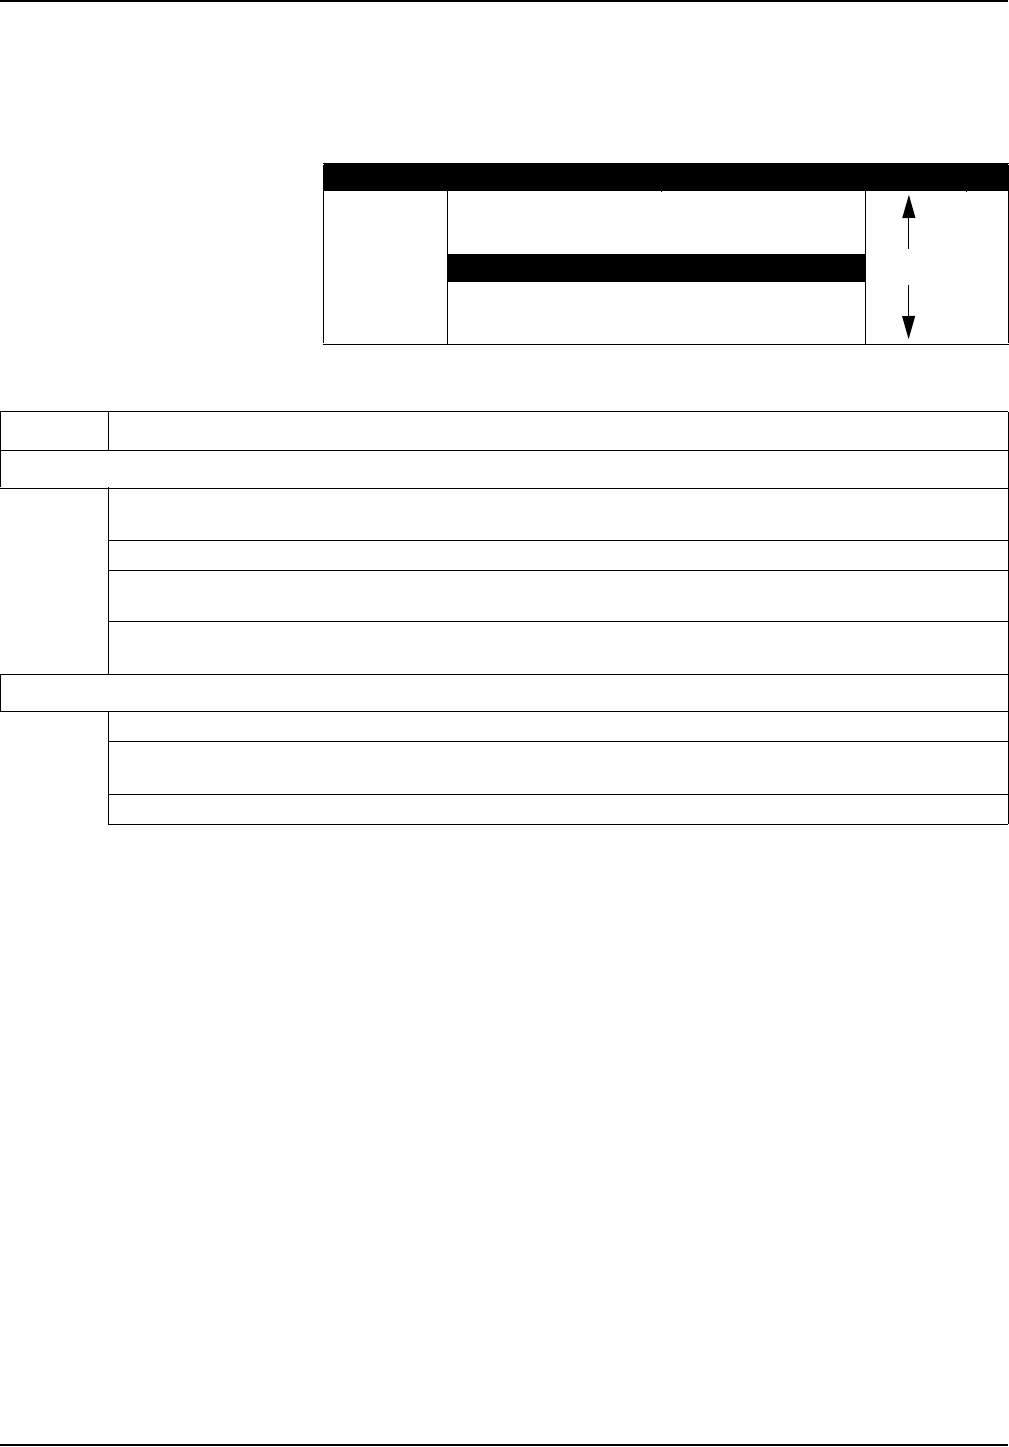
1. Highlight the desired display method using the up and down arrow soft
keys then press the Select soft key.
11:00 AM 21 - APR - 01 DISPLAY DATA
SELECT
DISPLAY DATA
DISPLAY BY GRAPH
RETURN
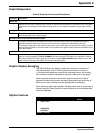
Table 27 Display Data Functions and Descriptions
Function Description
Display Data by Table
View from start: Displays the data for the selected channel beginning with the first (oldest) data point in
memory.
View from end: Displays the data for the selected channel beginning from the most recent point in memory.
View from time/date: Displays the data for the selected channel beginning from any desired time and date.
Enters a new desired time and date.
Note: Totals displayed are calculated by summing the logged data. If the date selected precedes available
logged data (memory has wrapped), the total will be incorrect.
Display Data by Graph
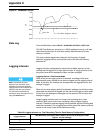
Graph day: Displays data for a specified date. Data for the selected date is graphed from midnight to midnight.
Graph point in time: Displays data for a specified time and date. The graph displays three hours of data with
the selected point in the time at the corner of the graph.
Graph partial day: Zooms in on a portion of the logged data.


