


159
Appendix C: Sonar
C.1 Introduction
The sonar provides a detailed underwater view that helps you to see
bottom structure and texture, underwater obstructions such as wrecks and
fish. Depth data is also provided and depth and temperature alarms can be
set.
C.2 How the sonar works
The sonar application uses a Digital Sounder Module (DSM) to process
sonar signals from a suitable transducer and provide a detailed underwater
view.
The transducer located on the bottom of the boat sends pulses of sound
waves into the water and measures the time it takes for the sound wave to
travel to the bottom and back. The returning sound echoes are affected by
bottom structure and any other objects in their path, e.g. wrecks, reefs and
fish.
The DSM processes these echoes and sends data to the sonar which
displays a visual interpretation of the underwater view. The strength of
echoes is indicated on the display by different colors. You can use this
information to determine the bottom structure, the size of fish and other
objects in the water, e.g. debris or air bubbles.
Notes:
1. The DSM will operate at a frequency of 50 kHz and/or 200 kHz.
2. Some transducers will enable the sonar to display water tempera-
ture and/or speed data.
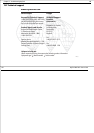
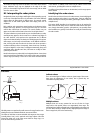
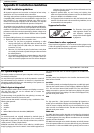
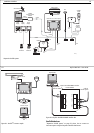
C.3 Bottom indications
The bottom usually produces a strong echo, enabling the sonar to see great
detail.
A hard bottom, such as sand, produces a thin line.
A softer bottom covered with seaweed produces a wide line, as the sound
waves reflect from different layers of the bottom. In this image the sonar is
getting a good echo from the bottom, so the upper layer of the bottom is
shown as dark gray.
An uneven bottom which is covered with rocks or coral produces a complex
display; the bottom image is irregular, with long tails pointing upward. A
wreck produces a similar image.
D7057_1
D7058_1
D7059_1
160 RayTech RNE V6.0 - Users Guide
Notice that the lower layer of the image is shown as a lighter gray, indi-
cating a weaker echo. This could mean that the upper layer is soft; some
sound waves may get through this layer and be reflected by a more solid
layer below.
It is also possible that the sound waves are making two complete trips -
hitting the bottom, bouncing off the boat, the reflecting off the bottom
again. This can happen if the water is shallow, the bottom is hard, or gain
is set high.
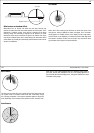
C.4 Displaying targets
When a target is detected, it is displayed on the sonar screen as a mark.
The size and shape of this mark is influenced by a combination of factors:
Boat speed
The shape of a target changes along with the boat speed. Slower speeds
return flatter, more horizontal marks. As your boat’s speed increases, the
target will tend to thicken and arch slightly; until at fast speeds the mark
resembles a double vertical line.
Target depth
The closer the target to the surface, the larger the mark on the screen. Indi-
vidual target depths can be displayed using the Target Depth ID function.
Target size
The larger the target, the larger the return on the sonar display. However,
the size of a fish target is dependent upon the size of the fish’s swim
bladder rather than it’s overall size. Swim bladder size varies from fish to
fish.
Transducer frequency
The same target will appear differently when the transducer frequency is
changed. The lower the frequency, the broader the mark.
C.5 Factors that can impair an image
Although weaker than bottom or other echoes, your sonar picture may be
impaired by echoes received from floating or submerged debris, air bubbles
or even your boats movement. This is known as ‘background noise ‘or
‘clutter’ and is controlled by the gain modes (gain, color gain and TVG).
Raymarine recommends that you allow your system to automatically
control the ideal sensitivity level based on depth and water conditions. You
can however adjust these settings manually if you prefer.
C.6 Range and shift values
By default, the sonar automatically adjusts the display depth range,
selecting the shallowest range that keeps the bottom in the lower half of
the display window.
Alternatively clicking the
RANGE
button lets you select the maximum
depth displayed on the scrolling bottom and A-Scope images. You can also
shift the image up or down within the current range. When you select Auto
Range, the shift adjustments is reset to zero. Range adjustments affect all
sonar windows.
The range setting is indicated in the sonar status bar. The following table
shows the range and shift values that are available.