


Chapter 9: Using tides and currents 73
Chapter 9: Using tides and currents
CAUTION: Tides and currents
Whilst every effort is made to ensure the accuracy of the
data used for tides and currents, this information can be
influenced by local conditions. It is therefore recommended
that consideration is given to obtaining accurate local infor-
mation wherever possible
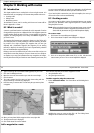
9.1 Introduction
Tide and current data is available for many areas on the chart application
of RayTech.
The predictions displayed for Tides and Currents are sufficiently accurate
under moderate weather conditions, for the coastal areas served by the
reference station, to be used for navigation planning. However, certain
weather fronts and storms can alter tidal patterns and influence predicted
times and heights.
In addition and in common with all similar products, tidal data is calculated
algorithmically and may, in some regions, be subject to error. If exact tidal
heights or times are critical to a particular passage, Raymarine recom-
mends that details are checked against a Tidal Almanac published by the
appropriate marine authority.
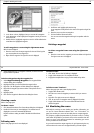
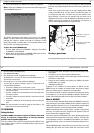
Setting the region
To make sure that the correct tide and current information is displayed, you
must set the region in which you are operating.
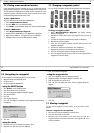
To set the tide region:
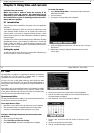
1. Select File/New Page/Tides . A new page will open showing the
default tide information.
2. Click
Presentation
.
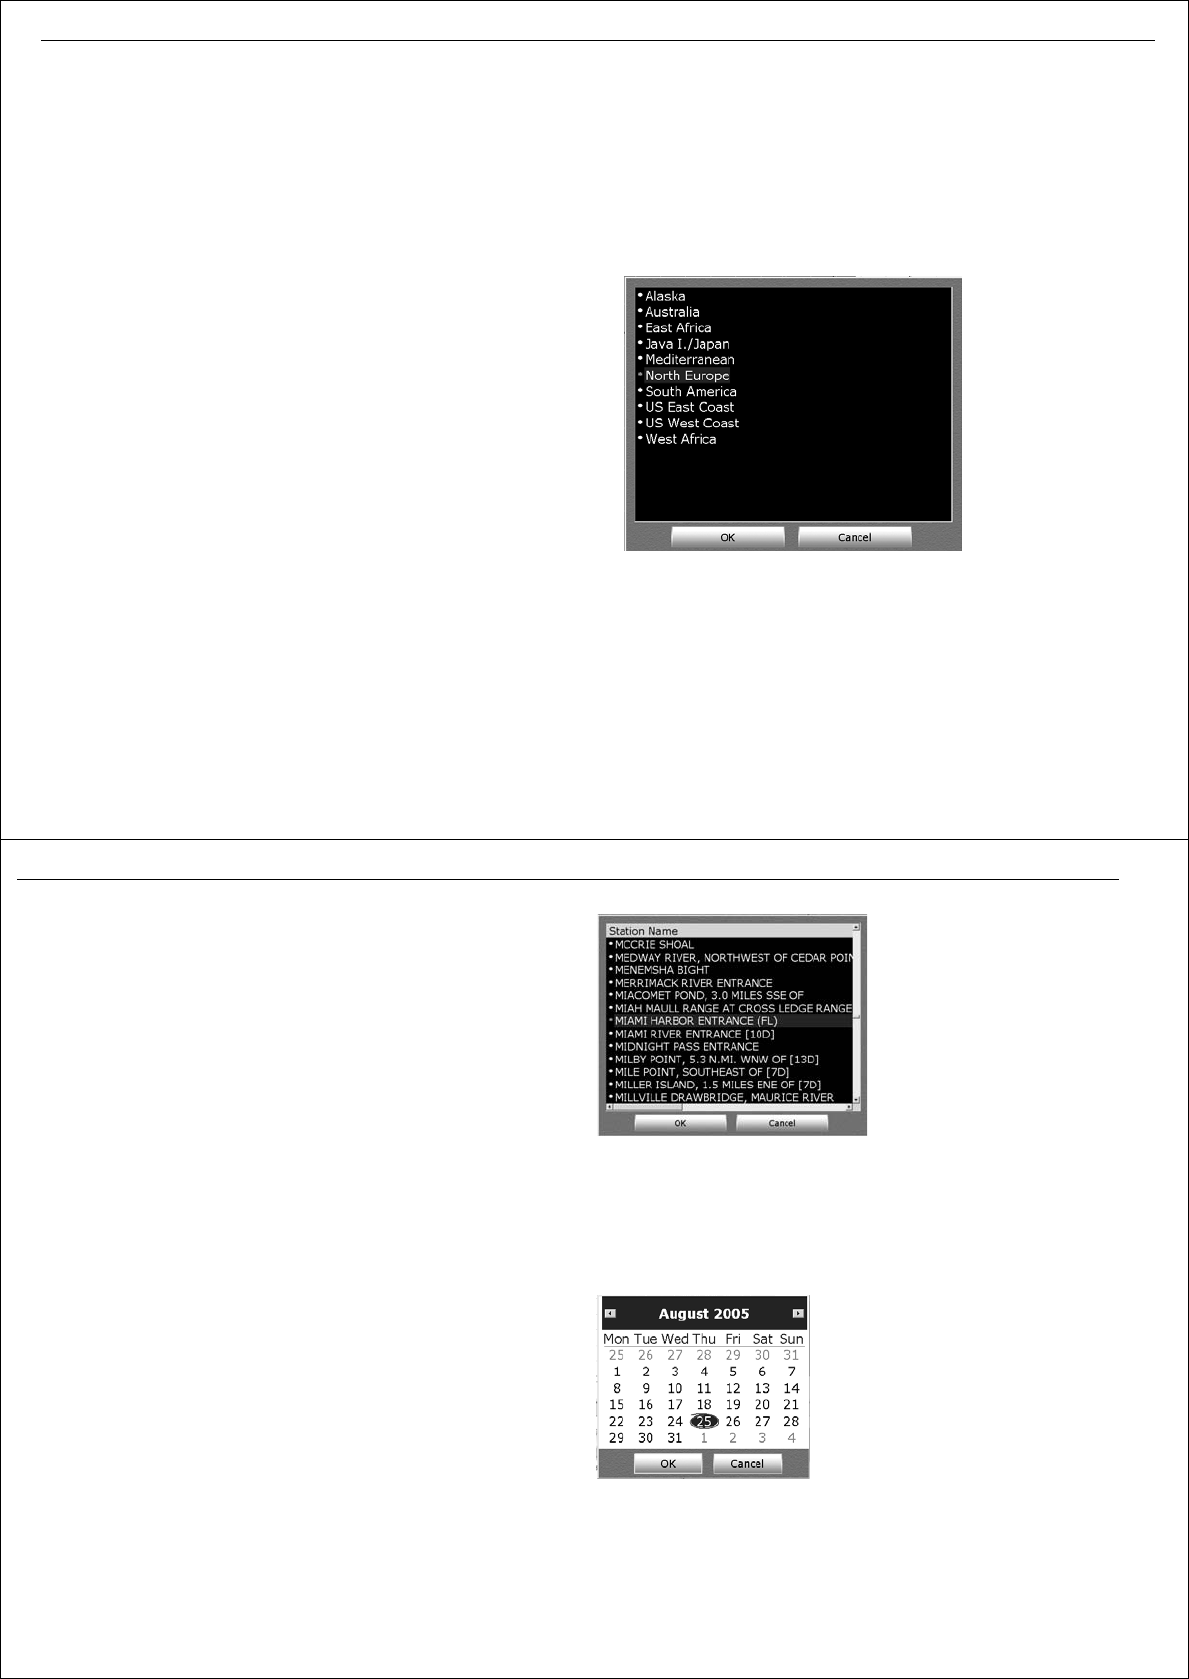
3. Click
Region
. The region dialog box is displayed.
4. Scroll and highlight the required area. Click
OK
. The area is now set to
that selected.
5. Repeat Steps 1 through 4 replacing Tides with Currents to set the
correct region.
74 RayTech RNS V6.0 - Users Guide
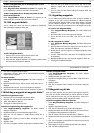
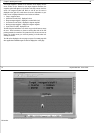
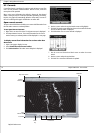
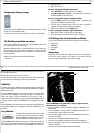
9.2 Tides
Tide height data - see page 62 - is a prediction for maximum and minimum
tide heights over a 24 hour period for a selected station in a selected
region.Data for sunrise and sunset is also provided.
As long as you have a valid global positioning system (GPS) time /date
signal being received by RayTech, the graph will automatically default to
showing today’s tides. If there is no signal then the graph will default to an
earlier date.
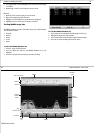
Some regions have non-sinusoidal tide patterns, with distorted or multiple
high and low water peaks and troughs. In such regions, it is better to refer
to the graph to determine high and low water times and heights rather
than using the textual description above the graph.
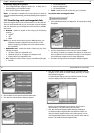
Open nearest tides
The open nearest tides feature enables you to access tidal information from
the tide station nearest to a selected position.
To use Open Nearest Tides:
1. Right click in an area of the chart. The right-mouse menu is displayed.
2. Click Open Nearest Tides. The tidal information for the tide station
nearest your selected position will be displayed in a new page.
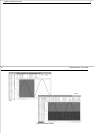
To display tidal height information for stations other than
the nearest:
1. Open a new page to display Tides.
2. Select View/Tides and Currents Toolbar.
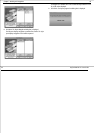
3. Click Select Station. The station name dialog box is displayed.
4. Use the cursor to select the required station name and highlight it.
5. Click OK. The station name dialog box closes and tidal information for
the selected station is displayed.
6. Click Select Date. The on-screen calendar is displayed.
7. Use the cursor and forward and back arrows to select the correct
month.
8. Use the cursor to select the required date.
9. Click OK. The tidal information is updated.
D8773_1