


Chapter 5: Using charts 37
Chapter 5: Using charts
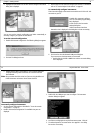
5.1 Introduction
RayTech utilizes chart layering technology, which permits you to simulta-
neously view different types of charts and maps, including navigational
charts, live radar, aerial photographs and weather data.
For full information on installing charts refer to Chapter 2 - Getting Started.
Use your charts safely
CAUTION: RayTech should not be used as a substitute for good
navigational practice nor for official government charts.
Until you are familiar with interpreting the chart display, you should take
every opportunity to compare displayed objects with visual targets, such as
buoys and coastal structures. You should practice harbor and coastal navi-
gation during daylight and in clear weather conditions. RayTech simulator
mode will also help you gain experience.
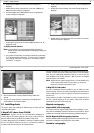
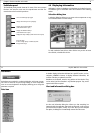
5.2 The chart screen
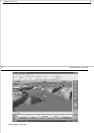
The chart is a digitized image of the paper chart for the selected area - see
“Default chart screen” on page 35. The chart shows objects, such as land-
masses, navigational objects and depth contours.
The amount of detail shown varies for different chart types and areas
covered. The scale at which the chart is shown also affects the amount of
detail shown. Cartographic information is also available for objects marked
on the chart. Source details for such objects as structures, lines and open
sea areas are also available. Using the advanced functions described in
Chapter 7 - Using RayTech’s Advanced features, information on the
weather, tides and currents can be overlaid on the charts.
When connected to a heading data source you can also overlay the radar
image on to the chart.
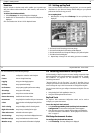
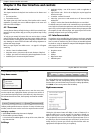
5.3 Opening a chart
To open a chart for the first time:
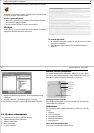
1. Click File/Open New Page. The open new page dialog box is
displayed.
2. Highlight the page type that you want to open (Navionics, C-Map or
raster).
3. Click
OK
.
D8751_1
38 RayTech RNS V6.0 - Users Guide
5.4 Moving around the chart
You can move around the chart using:
Chart panning
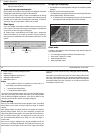
RayTech includes chart panning. Whenever you move the cursor near the
edge of a chart page and click, the chart will move in that direction. You
can also use the arrow keys on the keyboard to pan the chart.
Click over an object or position on a chart and the chart page or pane will
center on the location of the cursor.
Zooming
The are a number of ways to change the range, or zoom in and out of a
chart to see more or less of a given area.
Range In will show a smaller area of a chart, Range Out will show a
larger area of a chart. You can use:
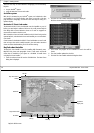
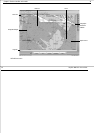
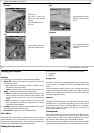
Finding your boat on the chart
Now that you have opened a chart, you will need to know where you are.
Your boat is displayed using a boat shaped icon.
To find your current position on the chart:
Click
Find Vessel
in the standard toolbar, or the
Find vessel
soft key.
The page or pane will automatically pan and the boat’s position will be
centered on the screen.
The page or pane will remain centered until you click the screen. The chart
will then re-center on the cursor’s location.
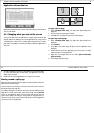
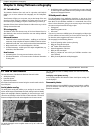
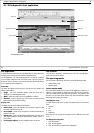
5.5 Choosing a chart type
You choose the type of chart you want to display using the charting
toolbar.
There are four primary buttons on the toolbar for controlling the type of
chart being displayed. These are:
• Raster charts.
• Vector (Navionics or C-Map).
• PhotoCharts Overlay (Navionics or raster).
• Topo Charts.
There is also a button to enable or disable radar overlay, and a button to
enable or disable chart quilting.
Menu Item Select Tools/ Range In or Range Out.
Keyboard Press
tab
to zoom in, or
Shift + tab
to zoom out.
Pathfinder panel Click the upper portion of the RANGE key to zoom
out, or the lower portion to zoom in.
Left mouse button Click and hold the left mouse button. As you drag the
mouse, the selected area will be highlighted in gray.
Release the button and the selected area will be
zoomed in.
Right mouse button When you right click on a chart, the right click menu is
displayed. Select Range In or Range Out.