


Chapter 13: RayTech advanced features 127
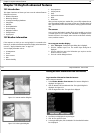
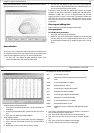
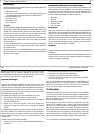
Downwind plot
The downwind plot screen calculates the best angle and boat speed when
sailing downwind and displays:
• VMG relative to Twa.
Click
Vmg
to view, then select the Tws range to plot by clicking on the
Tws (kts)
up/down arrows or by entering the numbers directly.
• Boat speed relative to Tws.
Click
Bsp
to view.
• Twa relative to Tws.
Click
Twa
to view.
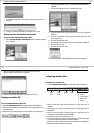
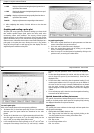
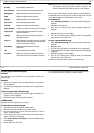
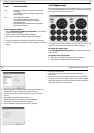
Vmc plot
The Vmc plot screen displays the Velocity Made good on Course towards a
specific mark or target. Although similar in concept to VMG, Vmc is equal
to VMG only when the bearing to the mark and wind direction are iden-
tical. Vmc is used when you expect the wind to change between your
present position and the target (primarily in long course racing).
In such an instance, it may be a smarter tactical move to sail toward your
target at the fastest possible speed, even if that heading isn’t directly
toward the target.
To use the Vmc plot, select the Course and true wind direction to be plotted
by clicking on the Course, Twd and Tws (kts) up/down arrows or entering
the numbers directly.
By default, course and Twd are initially derived from instrument input, but
the screen allows you to change these figures to calculate what happens if
the wind or course changes.
Instrument calibration for accurate data
The accuracy of data generated by your instruments and performance eval-
uation depends on accurate calibration. This section gives an introductory
explanation of instrument calibration, you must refer to the Manufacturer’s
manuals that came with your instruments for specific calibration proce-
dures. The following calibration principles are explained:
•Boat speed.
•Compass.
• Apparent wind angle.
•True wind angle.
• True wind speed.
Boat speed
Boat speed calibrations are entered directly into your instrumentation
system. While it may not be practical to check boat speed calibration on a
daily basis, you are encouraged to check this variable on a measured mile
as often as possible, as the paddle wheel impellers used to generate boat
speed data can change their physical characteristics markedly over their life
span due to the environment in which they operate. When making a
measured mile calibration, perform three consecutive runs over the known
distance, to eliminate any tidal current effects.
Compass
Compass calibration involves two procedures: deviation and heading error
calibration.
Calibrating deviation corrects compass error around different points of the
compass. Keep in mind that some instrument systems have the ability to
calibrate the compass automatically.
128 RayTech RNS V6.0 - Users Guide
Heading error calibration ensures that the heading the compass indicate
always reflects your true heading. Calibration of this kind is usually
achieved by piloting the boat along a known line of transit. For best results,
you should have your compass swung by a professional.
Apparent wind angle
Apparent wind angle (Awa) calibration should be carried out after the
masthead wand is initially installed on your boat. The wand may not lie
exactly on the fore and aft line of the boat. Awa calibration is necessary to
compensate for this. Awa should read zero when the vane is on the center-
line of your boat. If you don’t get a zero reading, you must enter an offset
value into the instrumentation system.
The amount of Awa alignment error can be established in two ways:
• Take the boat heading into wind and read the Awa angle.
• If the Awa value is not zero, there is a calibration error. This method is
not as accurate as the next.
• Perform two or three tacks upwind in even wind strength, then
compare the average Awa tack-to-tack using RayTech’s DataTrak
function.
Any calibration must be performed under even wind strength, as variances
will result in different Awa readings tack-to-tack. It is also important to
calibrate Awa offset in the absence of wind shear and wind gradient;
however, calibration in light air (such as a sea breeze filling in) is not
recommended.
To achieve successful Awa offset calibration:
• Choose a day with no wind shear, minimal gradient and a steady true
wind speed.
• Ensure that the DataTrak function is on-line and operational.
• Sail upwind at your optimum close-hauled angle.
• Complete four to six tacks in steady wind conditions.
• Use the ‘wand method’ of averaging the charts to ascertain the differ-
ence in Awa on each tack.
Once you have determined the Awa offset, enter it into the Masthead unit
offset parameter within your instrument system. Use half the difference
between the wind angle on each tack. This keeps the Awa symmetrical
tack-to -tack, because laylines are predicted based on the Awa.
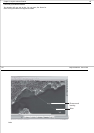
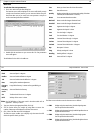
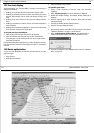
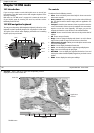
13.6 DataTrak
With RayTech connected to your boat’s instruments you can use DataTrak
to record any of your instrument channels and display the collected data as
a time-based graph. This is useful for looking at trends, averages, real time
data and comparing instrument data. Information can be displayed in
default or customized pages.
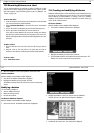
DataTrak graphs can be resized to fixed time intervals for quick data
capture. This is invaluable to you in capturing data for target and polar
calculations or in trying to ascertain minute changes in any recorded vari-
able overtime. RayTech allows for the display of DataTrak wand times.
When capturing data from DataTrak, vertical frames can be inserted in the
chart to delineate start and end points for the data capture. These lines,
called wands, represent a particular segment of time on the graph. The
time interval is reported at the top of the graph, in the blue status bar.
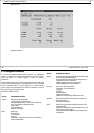
You can create graphs to display the following information: