


Chapter 5: Using charts 39
Note:
RayTech will use raster photos over Navionics photos when both
layers have been turned on.
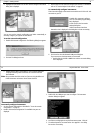
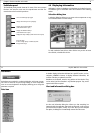
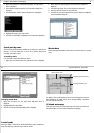
To select the chart type to be displayed:
Click the button for the type of chart you want to be displayed. The button
will highlight to indicate that chart type has been selected.
If there is no chart type enabled, or charts are unavailable at the level of
zoom that has been selected, only an aquamarine colored background will
be visible. You can either select a chart type from the toolbar, or adjust the
zoom level, using the range buttons, until the chart is visible.
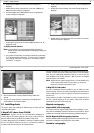
Chart layers
If you have multiple chart buttons enabled at the same time, then your
chart is layered. This means that one type of cartography is superimposed
on top of one or more other types of cartography.
All charting layers, except Navionics and C-Map, have a transparency
control which allows you to increase or decrease a layers transparency.
Each page or pane will default to it’s full transparency level when it is first
opened.
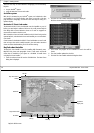
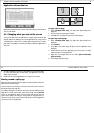
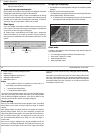
To adjust layer transparency:
1. Click the down arrow at the right of the chart type. The transparency slider is
displayed.
2. Move the cursor over the transparency slider.
i.To make the layer more opaque, place the cursor over the right of the trans-
parency slider and click. The value increases.
ii. To make the layer more transparent, place the cursor over the left of
the transparency slider and right-click. The value decreases.
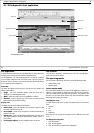
Chart order
In order for chart layering to work consistently, charts have been layered in
a pre-determined order.
• Your chart pages are layered as follows from bottom to top:
• Vector charts - Navionics or C-Map.
• Raster Navigational charts.
• Raster topographic charts.
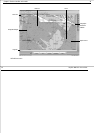
Down
arrow
Transparency
slider
20% level40% level
D8753_1
40 RayTech RNS V6.0 - Users Guide
• Raster or Navionics aerial photography charts.
• Radar overlay.*
• Orbimage Satellite Sea Temperature.**
• Orbimage Satellite Plankton.**
• GRIB weather data.***
Notes:
1. * Only available if RayTech is connected to an hsb
2
radar or E-
Series display and receiving a heading input.
2. ** Accessed from fishing toolbar.
3. *** Accessed from weather toolbar.
The order of layers cannot be changed. If you are having trouble viewing a
chart layer, try switching off all of the other layers on the charting toolbar
until the background appears aquamarine. Then click the button of the
chart type you want to view, and the cartography will appear.
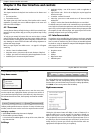
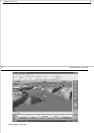
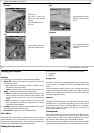
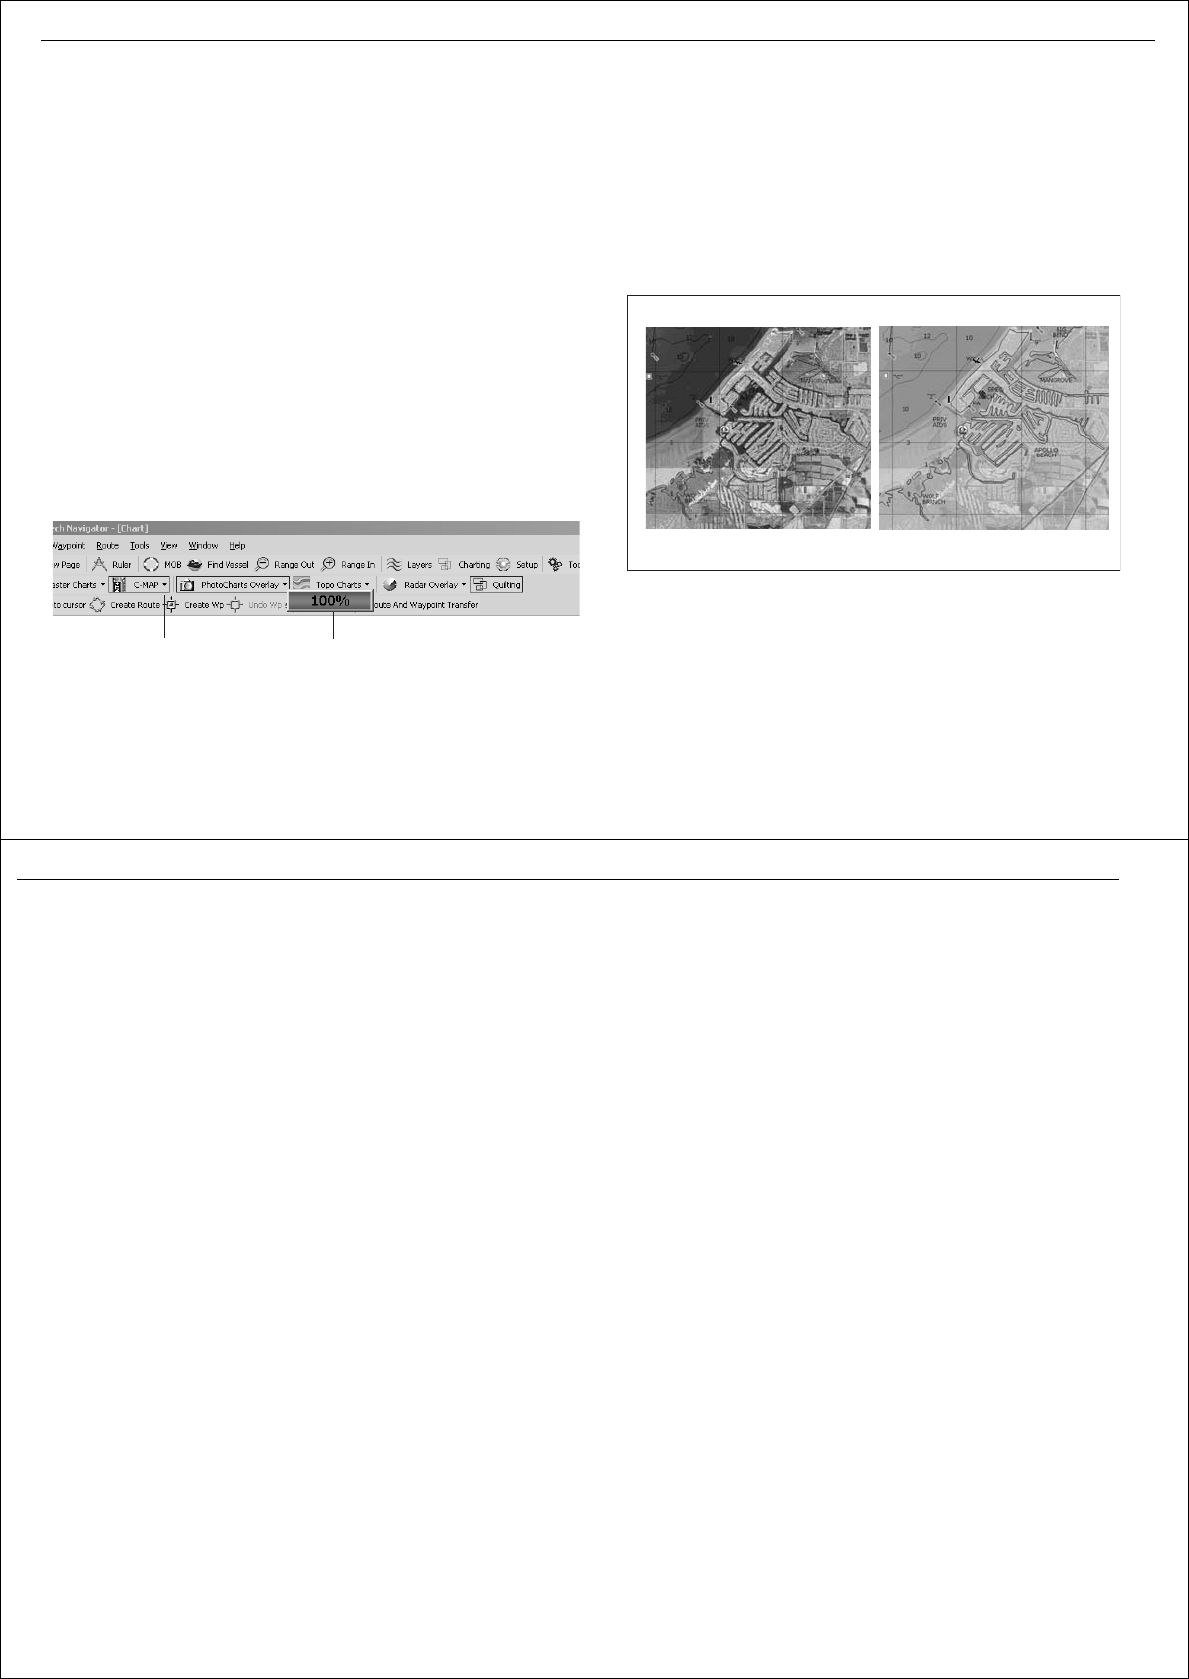
Chart quilting
When you are working with raster format navigation charts, the Quilting
button allows you the option of using a single chart image, or seamless
charting.
With quilting enabled, the system default for any opened chart window,
RayTech stitches together all of your raster cartography, connecting the
edges of the different charts together. This means that no manual interven-
tion is required to switch charts. You simply pan to the area you wish to
see. Chart detail will be affected as you range in or out to view larger or
smaller scales.
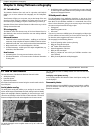
When you are using the quilting function, the best available chart for the
area you are in will always be displayed. This information is based on your
boat’s position, the focal point of the cursor and the range scale selected.
As you pan or zoom around the chart, cartography will be continuously
displayed.
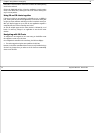
With quilting turned off, the chart at the focus of the display will be shown
alone. The scanned edges of the chart containing the latitude and longi-
tude scales, notes and chart numbers will become visible and all adjacent
charts will be hidden from view. Zooming in or out will cause the chart to
be enlarged or reduced in size.