


Chapter 13: RayTech advanced features 117
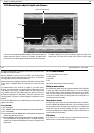
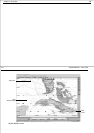
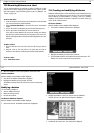
13.3 Measuring distances on a chart
You can measure distances to and from any point to another on a chart
using the ruler function. Simply by placing the cursor over a point, the lati-
tude and longitude, range and bearing point to point is displayed - see
“Rulers” on page 116
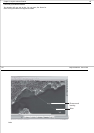
To set a new ruler:
1. Scroll and zoom the chart until you can see the places on the chart that
you want to measure the distance between.
2. Select Tools/Set New Ruler, or click the ruler icon on the standard
toolbar.
3. Click on the chart to set the point you want to start measuring from.
4. Click on the chart to set the point you want to measure to.
A line will be placed between the two points showing the distance
between them and the bearing from the first point to the second. The
latitude and longitude of the second point will be displayed in the chart
status bar.
To move a ruler:
1. Click and hold the cursor over the end of the ruler that you want to
move.
2. Drag the cursor to the new point on the chart that you want to
measure to. The distance and bearing information will be updated.
To clear a ruler:
Select Tools/Clear rulers.
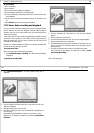
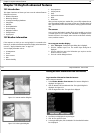
13.4 Creating and modifying databoxes
Databoxes within RayTech can be customized to show information that you
want to see, in the order that you want to see it. This can be achieved by
either modifying an existing databox, or creating a new one, in addition,
databoxes can be floated or docked as required. This section shows you
how to do all of these functions.
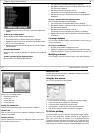
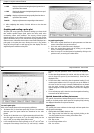
To float a databox:
With the databox and the databox toolbar displayed:
1. Click
Float
. The databox selection box is displayed.
2. Highlight the databox you want to float. Click
OK
.
3. Click the databox title bar and hold the left mouse button down. The
databox can now be moved to the required position.
D8790_1
118 RayTech RNS V6.0 - Users Guide
4. When the databox is in the required position, release the mouse.
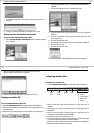
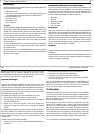
To dock a databox:
With the databox and the databox toolbar displayed:
1. Click
Dock
. The databox selection box is displayed.
2. Highlight the databox you want to dock. Click
OK
.
The databox is docked at the left of the screen and the current page
resizes.
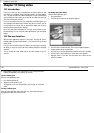
Modifying a databox
You can modify a databox to:
• Show an additional channel.
• Delete an existing channel.
• Re-order the channels.
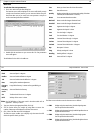
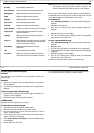
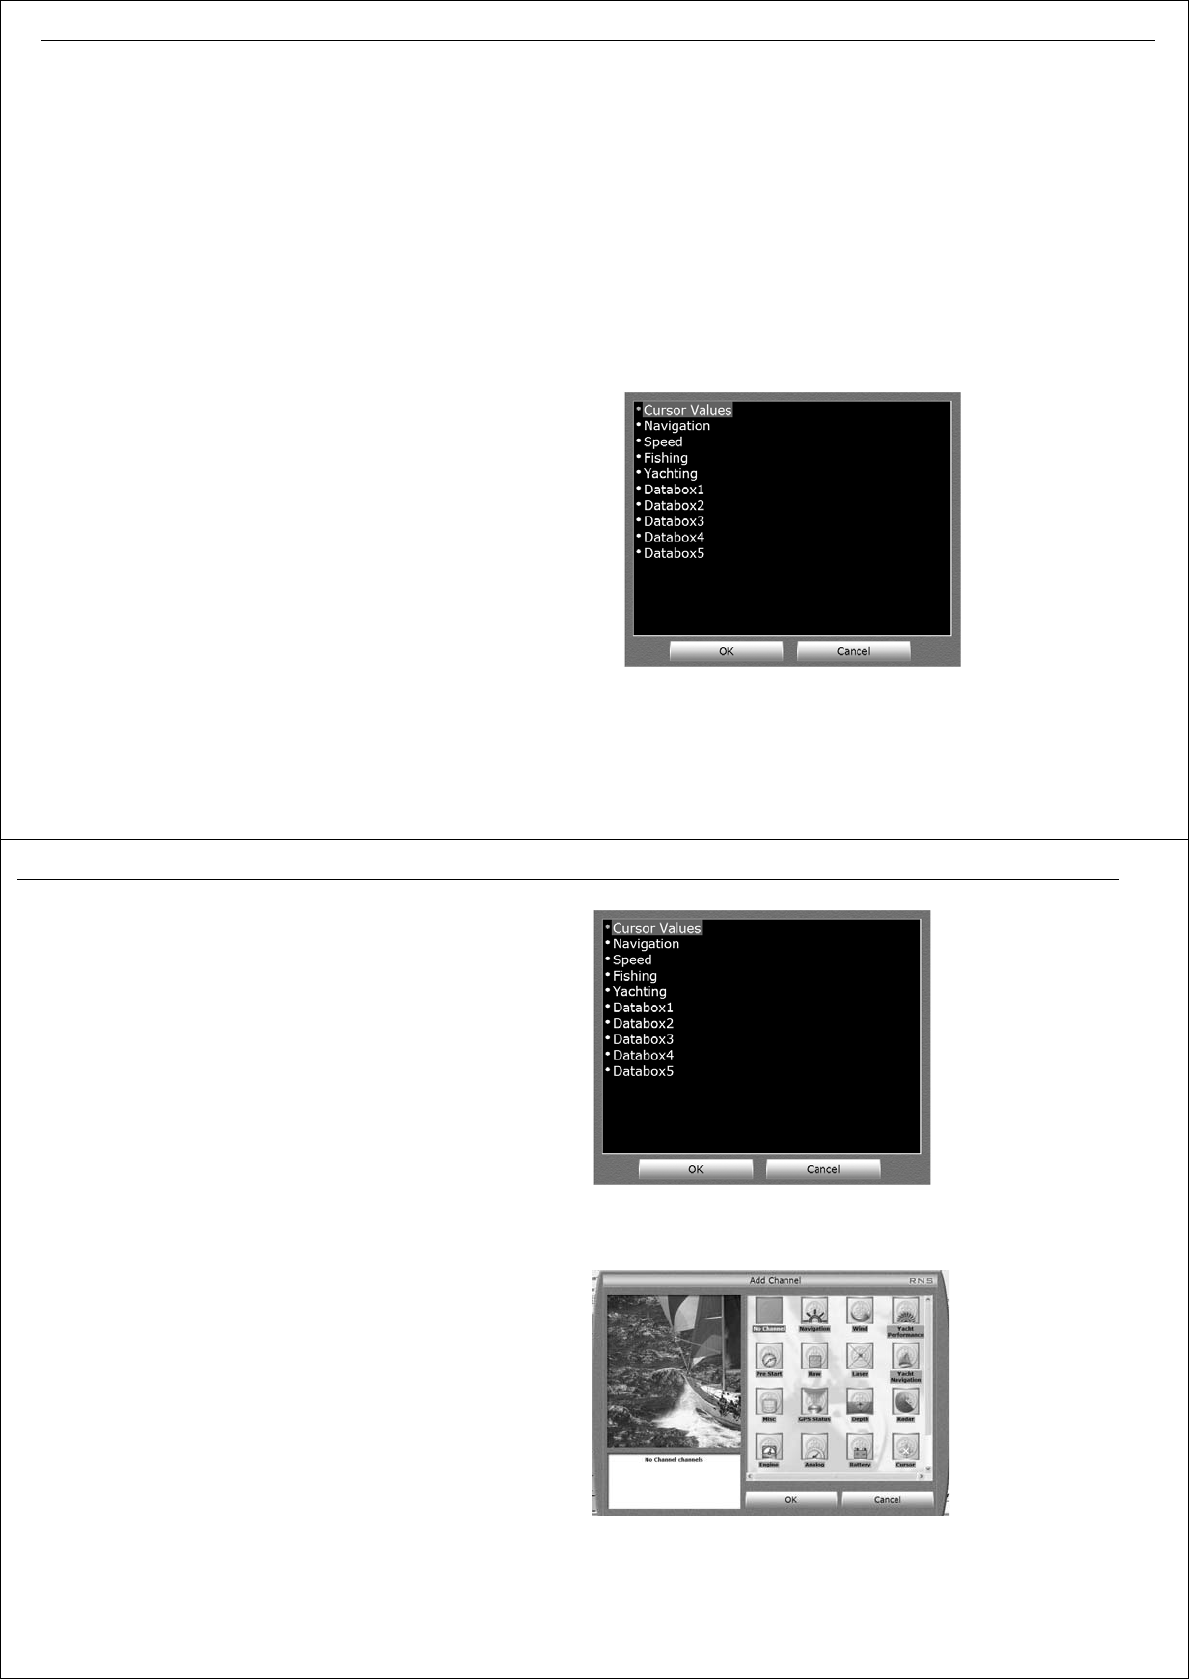
To show an additional channel:
With the databox and the databox toolbar displayed:
1. Click Insert Channel. The databox selection box is displayed.
2. Highlight the databox in which you want to show an additional
channel. Click OK. The Add Channel dialog box is displayed.
3. Double-click the channel icon. The channel list is displayed.
D8791_1
D
879
2_1