


11-21190-01004-03 Rev. B
Garmin GTN 625/635/650 Pilot’s Guide
Foreword
Getting
Started
Xpdr Ctrl
Com/Nav
FPL
Direct-To
Proc
Wpt Info
Map
Traffic
Terrain
Weather
Nearest
Music
Utilities
System
Messages
Symbols
Appendix
Index
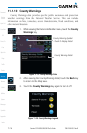
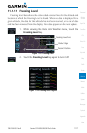
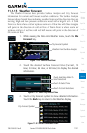
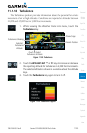
11.1.15 Weather Forecast
The Weather Forecast data provides Surface Analysis and City Forecast
information for current and forecast weather conditions. The Surface Analysis
forecast shows frontal lines indicating weather fronts and the direction they are
moving. High and Low pressure centers are noted with a large H or L. A Cold
Front is a front where cold air replaces warm air. A blue line with blue triangles
will point in the direction of cold air flow. A Warm Front is where warm air
replaces cold air. A red line with red half moons will point in the direction of
the warm air flow.
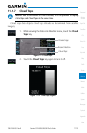
1. While viewing the Data Link Weather menu, touch the Wx
Forecast key.
Weather Front Surface Analysis
City Forecast Symbol
Figure 11-30 Surface Conditions
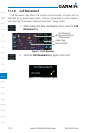
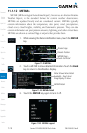
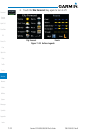
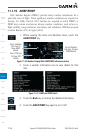
2. Touch the desired Surface Forecast time (Current, 12
Hour, 24 Hour, 36 Hour, or 48 Hour) to display the desired
information.
Touch To Scroll Selections
Touch To Select Time
Touch And Drag Slider To
Scroll Selections
Figure 11-31 Select City Forecast Time
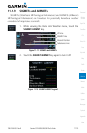
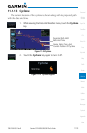
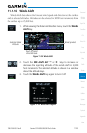
2. Touch a City Forecast symbol to show detailed information.
Touch the Back key to return to the Weather display.
City Forecast Symbol
Figure 11-32 Surface Conditions Detail