


50 GPSMAP
®
6000/7000 Series Owner’s Manual
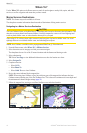
Almanac, Environmental, and On-boat Data
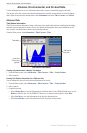
Wind Angle Data
Viewing the Wind Angle Data Graph
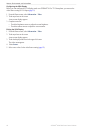
The chartplotter must be connected to the peripheral devices listed below to capture the data shown on the
wind speed graph.
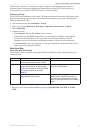
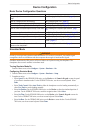
Wind Angle Description Required Sensors
Apparent Wind Shows wind direction data based on the ow
of air experienced while on a boat in motion�
This is the Apparent Wind Angle, which is
calculated in reference to the bow of the boat,
and is represented in degrees port or degrees
starboard�
A wind sensor�
True Wind Shows wind direction data based on the
ow of air experienced while on a stationary
boat� This is the True Wind Angle, which is
calculated in reference to the bow of the boat,
and is represented in degrees port or degrees
starboard� For the most accurate data, the
Wind Speed Source setting should be set to
Auto (page 59)�
A wind sensor and a speed sensor; or a wind
sensor and a GPS antenna�
Ground Wind Shows wind direction data based on the ow
of air experienced while on shore� This is
the Ground Wind Angle, which is calculated
in reference to north, and is represented in
degrees clockwise� North can be true north,
magnetic north, or grid north, depending upon
the conguration of the Heading reference
setting (page 61)�
A wind sensor, a water-speed sensor, a
heading sensor, and a GPS antenna; or a
wind sensor and a GPS antenna; or a wind
sensor, a water-speed sensor, and a heading
sensor�
1. From the Home screen, select > > .
2. Select the type of wind direction data included on the graph (, , or
).
Air and Water Temperature Data
Viewing the Air and Water Temperature Graph
The chartplotter must be connected to a water-temperature sensor or a temperature-capable transducer,
to capture the data shown on the water temperature graph. The chartplotter must be connected to an air-
temperature sensor to capture the data shown on the air temperature graph.
If you have turned on and congured the water temperature alarm (page 106), the graph shows in red any
water temperature data that is 2°F (1.1°C) above or below the temperature specied for the alarm.
1. From the Home screen, select > > .
2. Select the type of temperature information included on the graph ( or ).
Atmospheric Pressure Data
Viewing the Atmospheric Pressure Graph
The chartplotter must be connected to a barometric-pressure sensor to capture the data shown on the
atmospheric pressure graph.
From the Home screen, select > > .