


GPSMAP
®
6000/7000 Series Owner’s Manual 25
Charts and 3D Chart Views
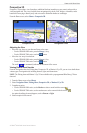
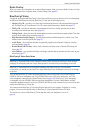
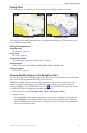
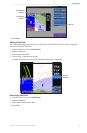
Fishing Chart
Use the Fishing chart for a detailed view of the bottom contours and depth soundings on the chart.
Fishing Chart Navigation Chart
The Fishing chart uses detailed bathymetric data on a preprogrammed BlueChart g2 Vision data card, and is
best for offshore deep-sea shing.
Fishing Chart Appearance
Using Waypoints
See “Waypoints” (page 34).
Using Tracks
See “Tracks” (page 39).
Showing Other Vessels
See “Conguring the Appearance of Other Vessels” (page 66).
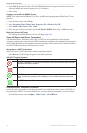
Showing Navaids
From the Home screen, select > > > > .
Showing Data Bars
See “Data Bars” (page 62).
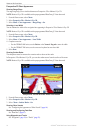
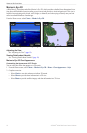
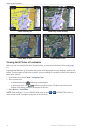
Showing Satellite Imagery on the Navigation Chart
You can overlay high-resolution satellite images on the land, on the sea, or on both portions of the Navigation
chart when using a preprogrammed BlueChart g2 Vision data card.
: When enabled, the high-resolution satellite images are only present at lower zoom levels. If you
cannot see the high-resolution images in your BlueChart g2 Vision region, you can zoom in further by
selecting the () key (GPSMAP 6000 series) or the button (GPSMAP 7000 series). You also can
set the detail level higher by changing the map zoom detail (page 11).
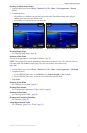
1. From the Home screen, select > > > .
2. Complete an action:
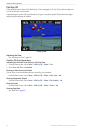
• Select to show standard chart information on the water, with photos overlaying the land.
• Select to show photos on both the water and the land at a specied opacity. Select and
hold or to adjust the photo opacity. The higher you set the percentage, the more the satellite
photos cover both land and water.