


GPSMAP
®
6000/7000 Series Owner’s Manual 49
Almanac, Environmental, and On-boat Data
Various sensors, transducers, or antennas are required to capture the data displayed on the graphs. For
information about connecting the chartplotter to peripheral devices using a NMEA 2000 network, see
Technical Reference for Garmin NMEA 2000 Products, on the included CD.
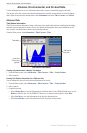
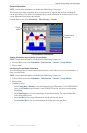
Conguring a Graph
You can set the scale and duration of each graph. The duration represents the time interval that appears on the
graph, and the scale represents the range of the measured data that appears on the graph, including specic
maximum and minimum values.
1. From the Home screen, select > .
2. Select a type of graph (, , , , or ).
3. Select .
4. Complete an action:
• Select , and select or to set the duration.
• Select . Select , , or. When you select , the chartplotter sets the optimal
minimum and maximum values for the range, based on environmental conditions. When the
chartplotter receives new data about environmental conditions, it adjusts the scale automatically.
• Select to allow the chartplotter to set the optimal minimum and maximum values for the
range, based on environmental conditions.
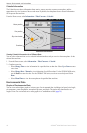
Wind Speed Data
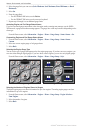
Viewing the Wind Speed Graph
The chartplotter must be connected to the peripheral devices listed below to capture the data shown on the
wind speed graph.
Wind Speed Description Required Sensors
Apparent Wind Shows wind speed data based on the ow of
air experienced while on a boat in motion�
A wind sensor�
True Wind Shows wind speed data based on the ow of
air experienced while on a stationary boat�
For the most accurate data, the Wind Speed
Source setting should be set to Auto
(page 59)�
A wind sensor and a speed sensor; or a wind
sensor and a GPS antenna�
Ground Wind Shows wind speed data based on the ow of
air experienced while on shore�
A wind sensor, a water-speed sensor, a
heading sensor, and a GPS antenna; or a
wind sensor and a GPS antenna; or a wind
sensor, a water-speed sensor, and a heading
sensor�
1. From the Home screen, select > > .
2. Select the type of wind speed data included on the graph (, , or
).