


68
recording barometer in your GPS unit can sharpen your weather skills
by tracking changes in barometric pressure at your location. It will tell
you if local atmospheric pressure is steady, rising or falling — and how
fast. Knowing this pressure history — and how to interpret it — will
make you a better forecaster and a better hunter. Here's how it works:
A barometer measures air pressure in the atmosphere. Most U.S.
weather reports list barometric pressure in inches, which is based on
the height of a column of mercury in a commercial barometer. Chang-
ing air pressure changes the height of the mercury.
Your HUNTc has a digital barometer that records air pressure in milli-
bars. Bar is the metric pressure equivalent of pounds per square inch,
and a millibar is 1/1000 of one bar. For example, a barometric reading
of 29.82 inches is equal to 1,009.1 mb. The unit of measure isn't par-
ticularly important here…the critical factor is determining the trend,
whether the air pressure is steady, rising or falling over time.
A larger number means higher pressure; a lower number means lower
pressure. When barometric pressure is higher than average, good
weather is expected. Low pressure indicates clouds and precipitation.
The relative change in pressure over time is an indication of a future
change in weather. This is feasible because a change in air pressure al-
ways occurs ahead of a change in weather conditions. (The air pressure
changes as a weather front moves through the area.) The pressure
change during an interval of about two to three hours is the best indica-
tor for a weather forecast.
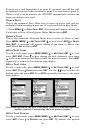
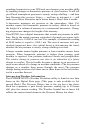
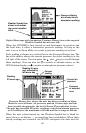
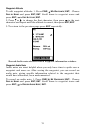
Interpreting Weather Information
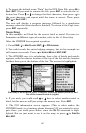
The iFINDER HUNT's Weather Prediction utility is found in two data
boxes on the Digital Data page. (This page is only available in Ad-
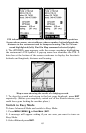
vanced Mode.) The Pressure History box at the top has a bar chart.
Each bar represents a past hourly pressure reading (up to 23 hours
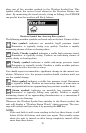
old), plus the current reading. The Weather Symbol box at lower left
reflects the current trend shown in the Pressure History bar chart.