


Reference Manual
00809-0100-4811, Rev CA
February 2006
6-5
Rosemount 3300 Series
Interface Measurements
for Semi-Transparent
Bottom Products
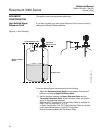
In interface applications where the bottom product has a low dielectric
constant, or if the signal is attenuated in the upper product, the amplitude of
the reflected signal is relatively low and difficult for the transmitter to detect. In
such a case it may be possible to detect the reflected signal if the
corresponding amplitude threshold is adjusted.
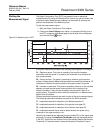
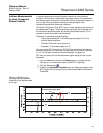
The Radar Configuration Tool (RCT) lets you view a waveform plot to analyze
the measurement signal. The plot shows the signal and the thresholds used
for the different amplitude peaks. By adjusting amplitude threshold T3 it is
possible to detect even weak interface signals.
Guidelines for amplitude threshold settings:
• The amplitude threshold T3 should be approximately 50 % of the
interface signal amplitude.
• Threshold T3 should not be less than 3.
• If possible, T3 should be higher than T2.
You can use the RCT software or a 375 Field Communicator to change the
amplitude thresholds. For the Field Communicator use the HART command
[1, 4, 5, 3]. See also “Amplitude Threshold Settings” on page 6-13.
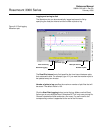
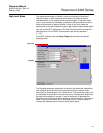
RCT lets you view a plot of the measurement signal along with the current
thresholds:
1. From the View menu choose the Plotting option, or double-click the
Plotting icon in the Advanced section of the RCT Project Bar.
2. Click the Read button .
3. To adjust the Amplitude Thresholds open the Advanced section in the
RCT Project Bar and choose Device Commands>Details>Set Nominal
Thresholds.
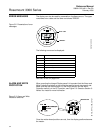
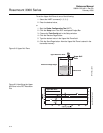
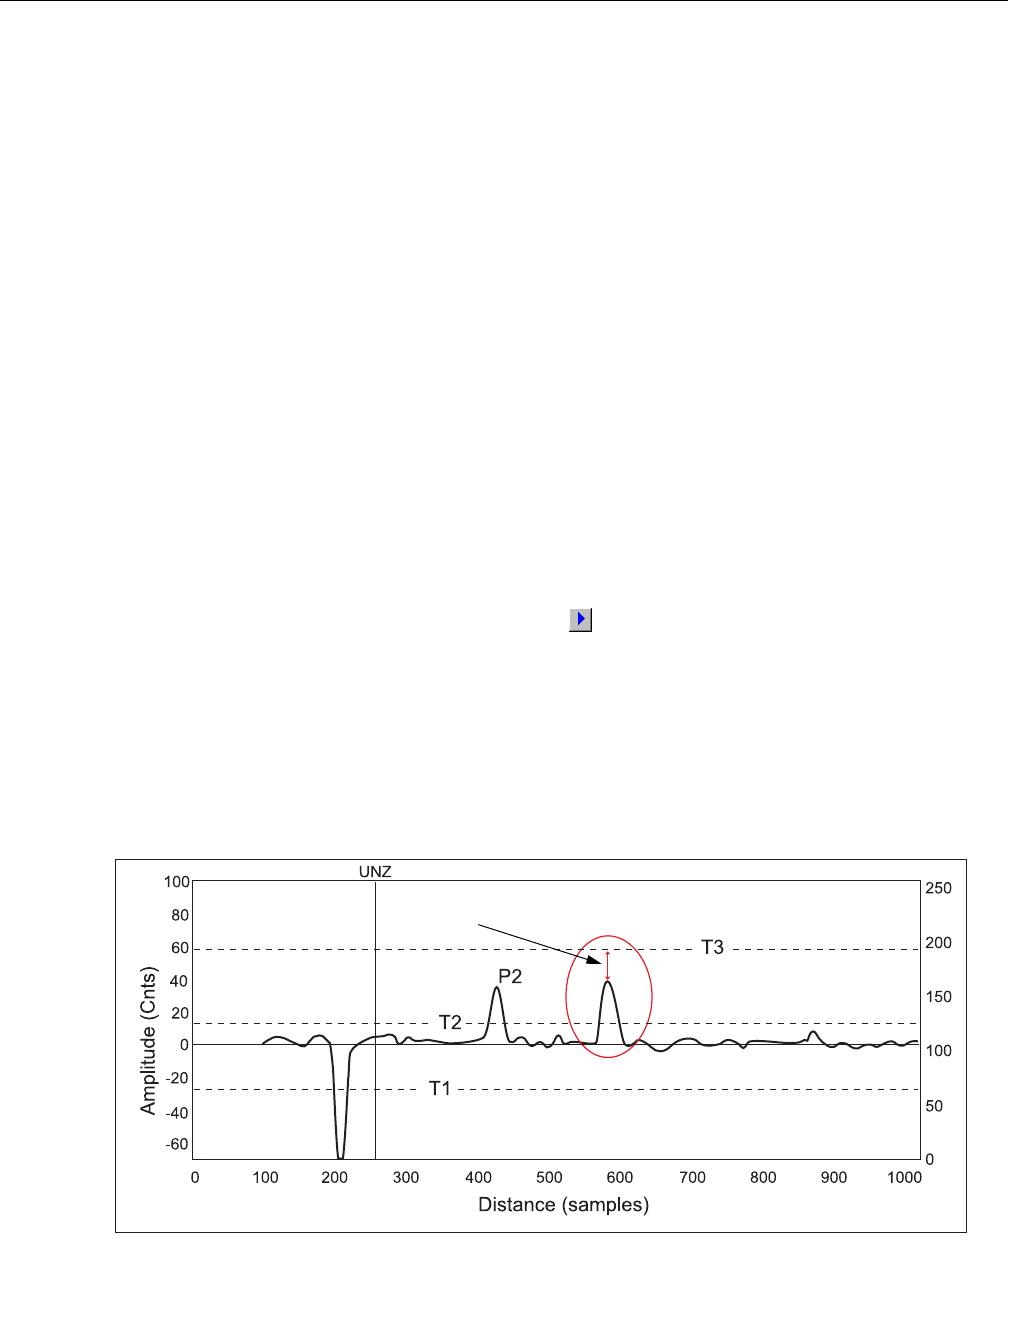
Figure 6-4. Waveform plot
indicating that the amplitude
threshold for the interface peak
is too high.
The amplitude threshold is above
the measurement signal peak
WAVEFORMPLOT INTERFACE LOW EPSILON