


• Symptoms [OBD II DTC’s : P0420 ~ P0424, P0430 ~ P0434]
Emissions test failure, poor fuel economy.
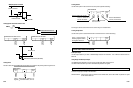
• Test Procedure
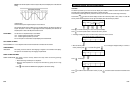
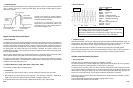
1. Connect one shielded test lead to the CH A and the other test lead to the CH B. Connect the ground leads of
both test leads to the engine GND’s and one lead probe to the sensor 1 (upstream sensor) output or HI and the
other lead probe to the sensor 2 (downstream sensor) output or HI.
2. Run the engine until the O2
sensors are warmed to at least 600 ˚F (315 ˚C) in closed loop operation.
3. Run the engine at idle while increasing engine speed.
4. Use this test to check the efficiency of the catalytic converter.
•
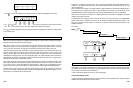
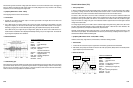
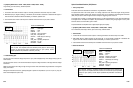
Reference Waveform
VEHICLE INFORMATION
YEAR : 1990
MAKE : Lexus
MODEL : LS400
ENGINE : 4.0 L
FUELSYS : Multiport Fuel Injection
PCM_PIN : 6 OXL1 BIK wire OXL2 24 Grn wire
STATUS : KOER (Key On Running)
RPM :
2500
ENG_TMP : Warming UP
VACUUM : 21 In. Hg
MILEAGE
:
79369
6-5
Downstream O
2
sensor voltage
rises as converter heats up and
begins to use excess oxygen to
burn HC and CO.
Waveform logged about
40 seconds after startup.
G
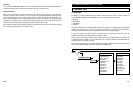
ood O2 sensor’s outpu
t
swing between 100 mV and 900 mV indica
t
es tha
t
the O
sensor is properly signalling PCM to control the fuel mixture.
The fluctuations in the downstream sensor’s signal are much smaller than that of the
the upstream sensor
.
As the
catalytic converter “lights off” (or
reaches operating
temperature) the signal goes higher due to less and less oxygen being present in the
exhaust stream as the catalyst begins to store and use oxygen for catalytic conversion.
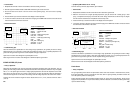
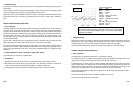
• Reference Waveform
VEHICLE INFORMATION
YEAR : 1995
MAKE : Plymouth
MODEL : Acclaim
ENGINE : 2.5 L
FUELSYS : Throttle Body Fuel Injection
PCM_PIN
:
41 BkGrn Wire
STATUS : KOER (Key On Running)
RPM : Idle
ENG_TMP : Operating Temperature
VACUUM
: 20 In. Hg
MILEAGE : 4350
NOTE
For a Titania-type O2 sensor, change the vertical range to 1 V/div.
• Troubleshooting Tips
The response time increases by aging and poisoning of the O2 sensor.
Peak to peak voltages should be at least 600 mV or greater with an average of 450 mV.
If the waveform is severely hashy, look for a misfire caused by Rich mixture, Lean mixture, ignition problem, vacuum
leak to an individual cylinder, injector imbalance, or carboned intake valves.
IMPORTANT: Don’t use a scan tool at the same time you are analyzing the O2 waveform on the instrument. The
PCM may go into a different operating strategy when diagnostics are activated by the scan tool.
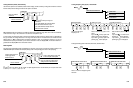
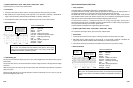
Dual O2 Sensor
•
Theory of Operation
Many vehicles utilize dual O2 sensors within the Feedback Fuel Control System. Both O2 sensors provide an output
voltage that present
t
he amount of oxygen in the exhaust stream
respec
t
ively before and after the catalytic
converter. The leading sensor signal is used as feedback for controlling the fuel mixture. The trailing sensor signal is
used by PCM to test efficiency of the catalytic converter. The signal amplitude from the trailing sensor will increase
when the efficiency of the catalytic converter declines over years. A good O2 sensor located downstream from the
catalyst should see much less fluctuations than its upstream counterpart during steady state operation. This is due to
the properly operating catalyst’s ability to consume oxygen when it is converting HC and CO, thus dampening the
fluctuations in the downstream sensor’s signal. That is, the difference in voltage amplitude from the sensors is a
measure for the ability of the catalyst to store oxygen for the conversion of harmful exhaust constituents.
6-4
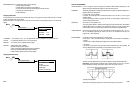
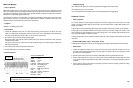
The maximum voltage when forced Rich should be greater than 800 mV. The minimum
voltage when forced Lean should be less than 200 mV. The maximum allowable
response time from Rich to Lean should be less than 100 ms.
Example of good O
2
waveform from property
operating TBI system at idle. Hash is normal.
Avg. O
2
voltage = 526 mV
“Moderate Hash”
This is normal