


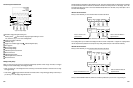
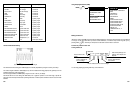
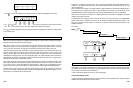
For VOLTS CURSORS,
Reading Test Results on the SCOPE (Component Tests only) Display
Measurement results can be displayed as numeric values (re
f
erred
to as readings) and waveform
.
The types of
readings depend on the test taking place.
For example, during a O2S SENSOR (Zirc) test, MAXIMUM and MINIMUM values are displayed as readings and
during a DUAL O2 SENSOR test MAXIMUM and MINIMUM values of the signals from the oxygen sensor before and
after the catalytic converter are displayed as readings. During a DI SECONDARY test, SPARK VOLTAGE, RPM,
BURN TIME, and BURN VOLTAGE are displayed as readings.
The values you see on the display most often depend on the vehicle under test. Refer to the Service Manual of the
vehicle manufacturer.
In Chapter 6 “Automotive Diagnostics & Applications” you can find typical results of certain applications.
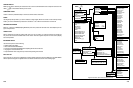
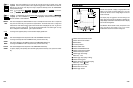
5.3 GMM DISPLAYS
The instrument performs cycle by cycle measurements of a variety of signal characteristics in Real Time and plots
them as
they change with time as a graph. The
instrument also
performs certain other
measurements on a
continuous basis, delivering the results for graphing 20 times per second. You can also plot the input signal directly
(as in SCOPE mode) by choosing LIVE.
The GMM display includes a meter reading showing the current value of the graphed parameter. This reading is an
average over many result values. In some cases, measurements are the maximum or minimum of a series of signal
values over the most recent 1 second interval.
The following table
shows measurements which can be plot
t
ed in GMM displays and the
type o
f
graphing
and
readout.
5-7
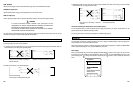
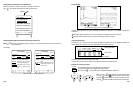
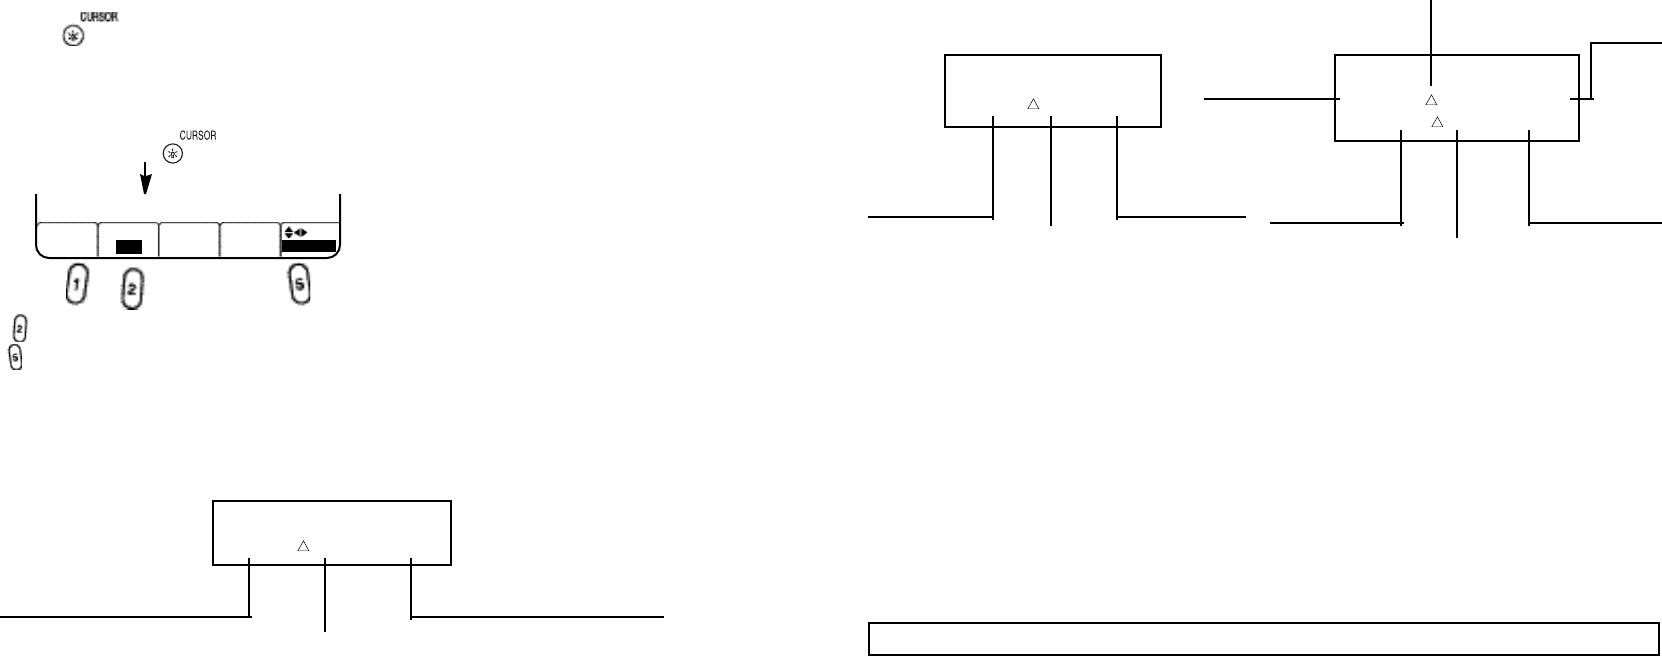
VOLTS 1 DELTA VOLTS 2
2.4 V 7.2 V 9.8 V
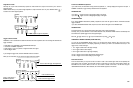
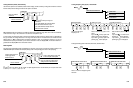
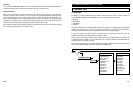
VOLTS 1 DELTA VOLTS 2
A: 130 mV 520 mV 650 mV
B: 24.0 mV 74 mV 98.0 mV
Sample value a t
VOLTS CURSOR
2 positio n o n the
waveform.
Samp le va lue at
CURSOR 2 position
on th e INPUT B
waveform.
Volts difference between CURSOR 1
an d CURSOR 2 position on the
INPUT B waveform.
Sample value at
CURSOR 1 position
o n the INPUT B
waveform.
Samp le va lue at
CURSOR 2 position
on th e INPUT A
waveform.
Volts dif feren ce b etween C URSOR 1 a nd
CURSOR 2 positions on the INPUT A waveform.
Samp le va lue at
CURSOR 1 position
on th e INPUT A
waveform.
Sample valu e at
VOLTS CURSOR 1
p osition on the
waveform.
Volts difference between CURSOR 1
and CURSOR 2 positions.
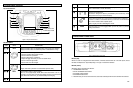
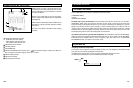
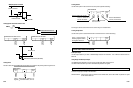
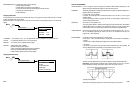
Cursor Key Function
A cursor is a vertical line or a horizontal line placed over the displayed waveform to measure values at certain points.
The instrument can measure signal details by using Cursors. This function is not possible for all tests.
Press CURSOR ( ) to display the Function key Menu for cursor operation.
If cursor operation is not possible for the actual measurement, the instrument beeps to alert you.
Two cursors (vertical lines) appear on the display.
The left cursor is named CURSOR 1, the right CURSOR 2.
• Press to set TIME cursor or VOLTS cursor or cursor OFF.
• Press to select the cursor you want to move (1 or 2).
• Use the Four Way arrow keys to move the cursors.
The top display shows readings related to values at the cursor positions.
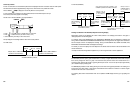
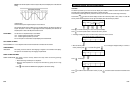
For TIME cursors,
5-6
TIME 1 DELTA TIME 2
20.4 ms 48.1 ms 68.5 ms
Sample value at TIME CURSOR 2
position on the waveform(s).
Sample value at TIME CURSOR
1 position on the waveform(s).
Time difference between TIME CURSOR 1
and TIME CURSOR 2 positions.
CURSORS
CURSOR KEYS
BACK
TIME CURSOR 1
CURSOR ( )