


2
Pan the chart to an offshore location.
The Marine Forecast or Offshore Forecast options appear
when forecast information is available.
3
Select Marine Forecast or Offshore Forecast.
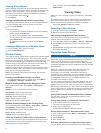
City Forecasts
City forecasts appear as weather symbols. The forecast is
viewed in 12-hour increments.
Symbol Weather Symbol Weather
Partly cloudy Fair (sunny, hot, clear)
Cloudy Rain (drizzle, sleet, showers)
Windy Foggy
Thunderstorms Snow (snow showers, flurries,
blizzard, blowing snow, sleet,
freezing rain, freezing drizzle)
Smoke (dusty, hazy)
Viewing Sea Conditions
The Sea Conditions feature shows information about surface
conditions, including winds, wave height, wave period, and wave
direction.
Select Charts > Sea Conditions.
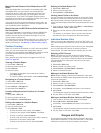
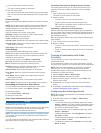
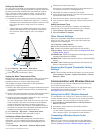
Surface Winds
Surface wind vectors appear on the Sea Conditions chart using
wind barbs that indicate the direction from which the wind is
blowing. A wind barb is a circle with a tail. The line or flag
attached to the tail of the wind barb indicates the wind speed. A
short line represents 5 knots, a long line represents 10 knots,
and triangle represents 50 knots.
Wind Barb Wind Speed Wind Barb Wind Speed
Calm 20 knots
5 knots 50 knots
10 knots 65 knots
15 knots
Wave Height, Wave Period, and Wave Direction
Wave heights for an area appear as variations in color. Different
colors indicate different wave heights, as shown in the legend.
The wave period indicates the time (in seconds) between
successive waves. Wave period lines indicate areas that have
the same wave period.
Wave directions appear on the chart using red arrows. The
direction of each arrow pointer indicates the direction in which a
wave is moving.
Viewing Forecast Sea Conditions Information for
Another Time Period
1
Select Charts > Sea Conditions.
2
Select an option:
• To view forecasted sea conditions for the next 36 hours, in
12-hour increments, select Next Forecast multiple times.
• To view the forecasted sea conditions for the previous 36
hours, in 12-hour increments, select Previous Forecast
multiple times.
Viewing Fishing Information
The weather Fishing chart shows present water temperature,
present surface pressure conditions, and fishing forecasts.
Select Charts > Fishing.
Surface Pressure and Water Temperature Data
Surface-pressure information appears as pressure isobars and
pressure centers. Isobars connect points of equal pressure.
Pressure readings can help to determine weather and wind
conditions. High-pressure areas are generally associated with
fair weather. Low-pressure areas are generally associated with
clouds and the chance of precipitation. Isobars packed closely
together show a strong pressure gradient. Strong pressure
gradients are associated with areas of stronger winds.
Pressure units are shown in millibars (mb), inches of Mercury
(inHg), or hectopascals (hPa).
Colored shading indicates the surface temperature of the water,
as shown in the legend in the corner of the display.
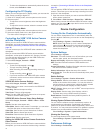
Forecasting Fish Locations
You can show areas that contain optimal weather conditions for
specific species of fish.
NOTE: This feature is not available on all devices and in all
subscriptions.
1
From the weather Fishing chart, select Menu > Fish
Species.
2
Select a species of fish.
3
Select On.
4
Repeat steps 2 and 3 to show areas with optimal weather
conditions for additional species of fish.
Shaded areas indicate optimal fishing areas. If you have
selected more than one species of fish, you can select a
shaded area to view the fish species that are included in the
shaded area.
Changing the Sea Surface Temperature Color Range
You can change the color range dynamically to view higher
resolution sea surface temperature readings.
1
From the weather fishing chart, select Menu > Sea
Temperature.
2
Select an option:
• To allow the chartplotter to adjust the temperature range
automatically, select Auto Configure.
The chartplotter automatically finds the lower and upper
limits for the current screen, and updates the temperature-
color scale.
• To enter the lower and upper limits for the temperature
range, select Lower Limit or Upper Limit, and enter the
lower or upper limit.
Visibility Information
Visibility is the forecast maximum horizontal distance that can be
seen at the surface, as shown in the legend on the left of the
screen. Variations in the visibility shading show the forecast
change in surface visibility.
NOTE: This feature is not available on all devices and in all
subscriptions.
Select Charts > Visibility.
Viewing Forecast Visibility Information for Another
Time Period
1
Select Charts > Visibility.
2
Select an option:
• To view the visibility forecast for the next 36 hours, in 12-
hour increments, select Next Forecast multiple times.
• To view the visibility forecast for the previous 36 hours, in
12-hour increments, select Previous Forecast multiple
times.
SiriusXM Weather 33