


Showing Satellite Imagery on the Navigation Chart
NOTE: This feature is available with premium charts, in some
areas.
You can overlay high-resolution satellite images on the land or
on both land and sea portions of the Navigation chart.
NOTE: When enabled, high-resolution satellite images are
present only at lower zoom levels. If you cannot see high-
resolution images in your optional chart region, you can select
to zoom in. You also can set the detail level higher by changing
the map zoom detail.
1
From the Navigation chart, select Menu > Chart Setup >
Satellite Photos.
2
Select an option:
• Select Land Only to show standard chart information on
the water, with photos overlaying the land.
• Select Photo Map to show photos on both the water and
the land at a specified opacity. Use the slider bar to adjust
the photo opacity. The higher you set the percentage, the
more the satellite photos cover both land and water.
Viewing Aerial Photos of Landmarks
Before you can view aerial photos on the Navigation chart, you
must turn on the Satellite Photos setting in the chart setup.
NOTE: This feature is available with premium charts, in some
areas.
You can use aerial photographs of landmarks, marinas, and
harbors to help orient yourself to your surroundings or to
acquaint yourself with a marina or a harbor prior to arrival.
1
From the Navigation chart, select a camera icon:
• To view an overhead photo, select .
• To view a perspective photo, select . The photo was
taken from the location of the camera, pointed in the
direction of the cone.
2
Select Aerial Photo.
Automatic Identification System
The Automatic Identification System (AIS) enables you to
identify and track other vessels, and alerts you to area traffic.
When connected to an external AIS device, the chartplotter can
show some AIS information about other vessels that are within
range, that are equipped with a transponder, and that are
actively transmitting AIS information.
The information reported for each vessel includes the Maritime
Mobile Service Identity (MMSI), location, GPS speed, GPS
heading, time that has elapsed since the last position of the
vessel was reported, nearest approach, and time to the nearest
approach.
Some chartplotter models also support Blue Force Tracking.
Vessels being tracked with Blue Force Tracking are indicated on
the chartplotter with a blue-green color.
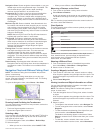
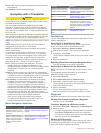
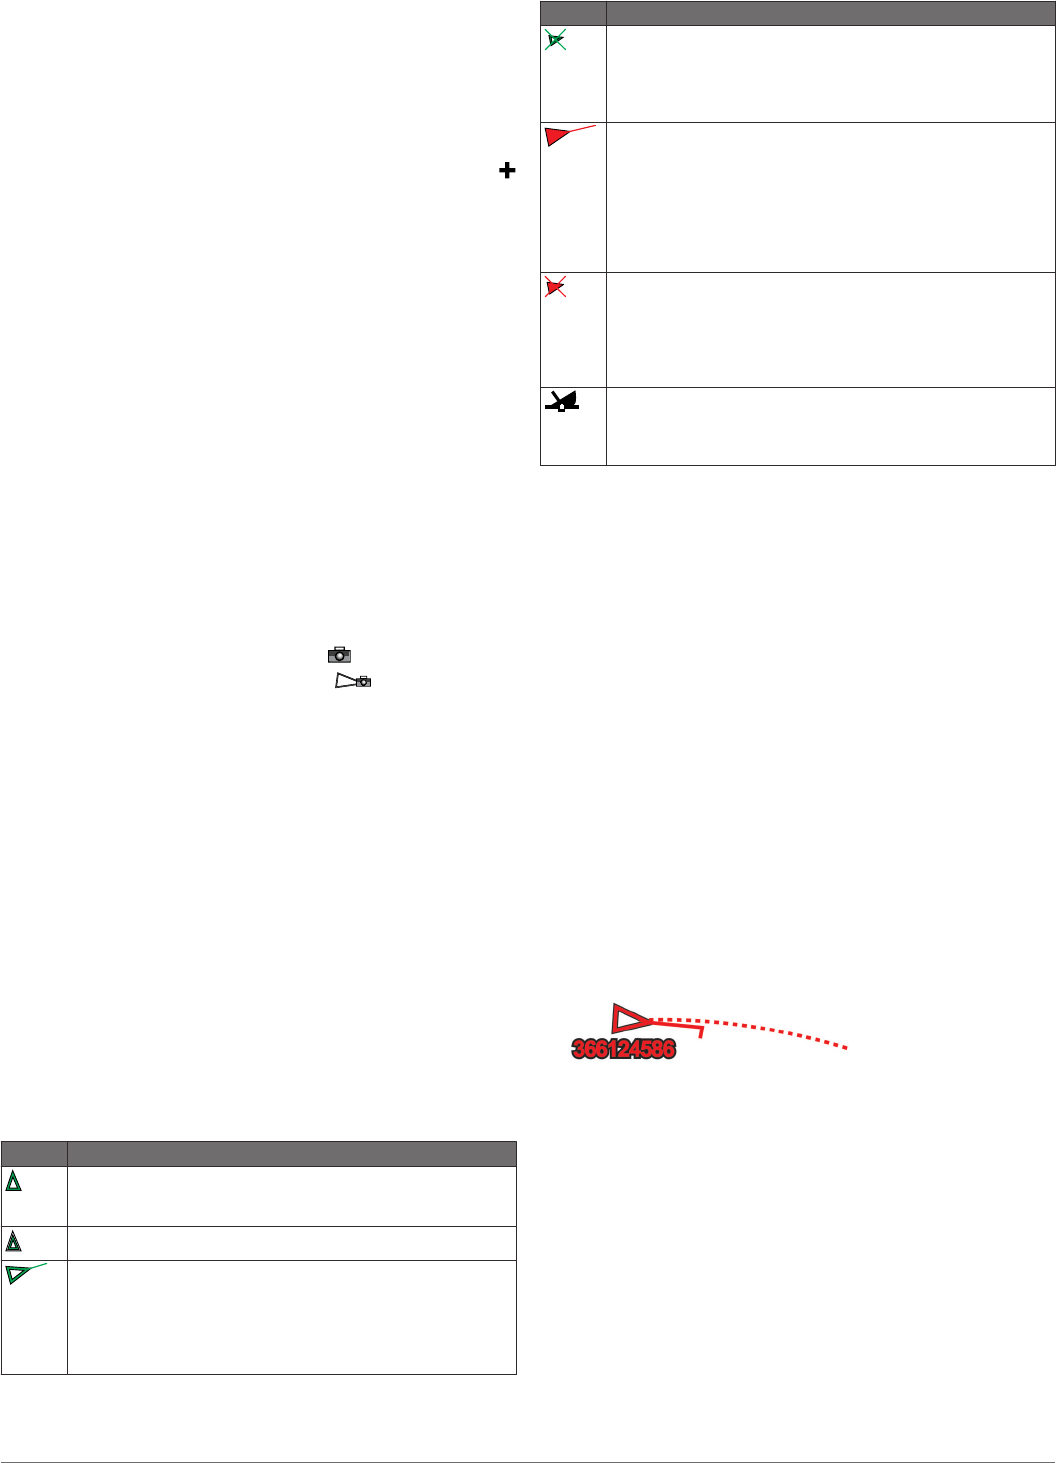
AIS Targeting Symbols
Symbol Description
AIS vessel. The vessel is reporting AIS information. The
direction in which the triangle is pointing indicates the
direction in which the AIS vessel is moving.
Target is selected.
Target is activated. The target appears larger on the chart. A
green line attached to the target indicates the heading of the
target. The MMSI, speed, and direction of the vessel appear
beneath the target, if the details setting has been set to Show.
If the AIS transmission from the vessel is lost, a message
banner appears.
Symbol Description
Target is lost. A green X indicates that the AIS transmission
from the vessel is lost, and the chartplotter displays a
message banner asking whether the vessel should continue
to be tracked. If you discontinue vessel tracking, the lost
target symbol disappears from the chart or the 3D chart view.
Dangerous target in range. The target flashes while an alarm
sounds and a message banner appears. After the alarm has
been acknowledged, a solid red triangle with a red line
attached to it indicates the location and the heading of the
target. If the safe-zone collision alarm has been set to Off, the
target flashes, but the audible alarm does not sound and the
alarm banner does not appear. If the AIS transmission from
the vessel is lost, a message banner appears.
Dangerous target is lost. A red X indicates that the AIS
transmission from the vessel is lost, and the chartplotter
displays a message banner asking whether the vessel should
continue to be tracked. If you discontinue vessel tracking, the
lost dangerous target symbol disappears from the chart or the
3D chart view.
The location of this symbol indicates the closest point of
approach to a dangerous target, and the numbers near the
symbol indicate the time to the closest point of approach to
that target.
NOTE: Vessels being tracked with the Blue Force Tracking
feature are indicated with a blue-green color regardless of their
status.
Heading and Projected Course of Activated AIS
Targets
When heading and course over ground information are provided
by an activated AIS target, the heading of the target appears on
a chart as a solid line attached to the AIS target symbol. A
heading line does not appear on a 3D chart view.
The projected course of an activated AIS target appears as a
dashed line on a chart or a 3D chart view. The length of the
projected course line is based on the value of the projected
heading setting. If an activated AIS target is not transmitting
speed information, or if the vessel is not moving, a projected
course line does not appear. Changes in the speed, course over
ground, or rate of turn information transmitted by the vessel can
impact the calculation of the projected course line.
When course over ground, heading, and rate of turn information
are provided by an activated AIS target, the projected course of
the target is calculated based on the course over ground and the
rate of turn information. The direction in which the target is
turning, which is also based on the rate of turn information, is
indicated by the direction of the barb at the end of the heading
line. The length of the barb does not change.
When course over ground and heading information are provided
by an activated AIS target, but rate of turn information is not
provided, the projected course of the target is calculated based
on the course over ground information.
Showing AIS and MARPA Vessels on a Chart or on a
3D Chart View
Before you can show AIS vessels on a chart, you must have an
external AIS device and active transponder signals from other
vessels. Mini Automatic Radar Plotting Aid (MARPA)
functionality works with radar.
You can configure how other vessels appear on a chart or on a
3D chart view. The display range and MARPA settings
configured for one chart or one 3D chart view are applied only to
that chart or to that 3D chart view. The details, projected
heading, and trails settings configured for one chart or one 3D
chart view are applied to all charts and to all 3D chart views.
Charts and 3D Chart Views 5