


Navigation and Fishing Chart Setup
NOTE: Not all settings apply to all charts and 3D chart views.
Some settings require external accessories or applicable
premium charts.
From the Navigation chart or Fishing chart, select Menu > Chart
Setup.
Satellite Photos: Shows high-resolution satellite images on the
land or on both land and sea portions of the Navigation chart,
when certain premium maps are used Showing Satellite
Imagery on the Navigation Chart, page 5.
Water Overlay: Enables relief shading, which shows the
gradient of the bottom with shading, or sonar imagery, which
helps identify the density of the bottom. This feature is
available only with some premium maps.
Tides & Currents: Shows current station indicators and tide
station indicators on the chart Showing Tides and Current
Indicators, page 4 and enables the tides and current slider,
which sets the time for which tides and currents are reported
on the map.
Roses: Shows a compass rose around your boat, indicating
compass direction oriented to the heading of the boat. A true
wind direction or apparent wind direction indicator appears if
the chartplotter is connected to a compatible marine wind
sensor. When in sailing mode, true and apparent wind are
shown on the wind rose.
Lake Level: Sets the present water level of the lake. This
feature is available only with some premium maps.
Inset Map: Shows a small map centered on your present
location.
Weather: Sets which weather items are shown on the chart,
when the chartplotter is connected to a compatible weather
receiver with an active subscription. Requires a compatible,
connected antenna and an active subscription.
Chart Appearance: See Chart Appearance Settings, page 7.
Waypoints and Tracks Settings on the Charts and
Chart Views
From a chart or a 3D chart view, select Menu > Waypoints and
Tracks.
Tracks: Shows tracks on the chart or 3D chart view.
Waypoints: Shows the list of waypoints (Viewing a List of all
Waypoints, page 9).
Create Waypoint: Creates a new waypoint.
Waypoint Display: Sets how to display waypoints on the chart.
Active Tracks: Shows the active track options menu.
Saved Tracks: Shows the list of saved tracks (Viewing a List of
Saved Tracks, page 12).
Tracks Display: Sets which tracks to display on the chart based
on track color.
Chart Appearance Settings
You can adjust the appearance of the different charts and 3D
chart views. Each setting is specific to the chart or chart view
being used.
NOTE: Not all settings apply to all charts and 3D chart views
and chartplotter models. Some options require premium maps or
connected accessories.
From a chart or 3D chart view, select Menu > Chart Setup >
Chart Appearance.
Orientation: Sets the perspective of the map.
Detail: Adjusts the amount of detail shown on the map, at
different zoom levels.
Heading Line: Shows and adjusts the heading line, which is a
line drawn on the map from the bow of the boat in the
direction of travel, and sets the data source for the heading
line.
World Map: Uses either a basic world map or a shaded relief
map on the chart. These differences are visible only when
zoomed out too far to see the detailed charts.
Spot Depths: Turns on spot soundings and sets a dangerous
depth. Spot depths that are equal to or more shallow than the
dangerous depth are indicated by red text.
Safety Shading: Sets the shades from the shoreline to the
specified depth.
Depth Range Shading: Specifies an upper and lower depth to
shade between.
Symbols: Shows and configures the appearance of various
symbols on the chart, such as the vessel icon, navaid
symbols, land POIs, and light sectors.
Inset Map: Shows a map zoomed in on the vessel's location in
the corner of the main map.
Style: Sets how the chart appears over 3D terrain.
Hazard Colors: Shows shallow water and land with a color
scale. Blue indicates deep water, yellow is shallow water, and
red is very shallow water.
Safe Depth: Sets the appearance of a safe depth for the
Mariner’s Eye 3D chart view.
NOTE: This setting affects only the appearance of hazard
colors for the Mariner’s Eye 3D chart view. It does not affect
the safe water depth Auto Guidance setting or the sonar
shallow water alarm setting.
Range Rings: Shows and configures the appearance of range
rings, which help you to visualize distances in some chart
views.
Lane Width: Specifies the width of the navigation lane, which is
the magenta line in some chart views that indicates the
course to your destination.
Other Vessels Settings on the Charts and Chart Views
NOTE: These options require connected accessories, such as
an AIS receiver or VHF radio.
From a chart or a 3D chart view, select Menu > Other Vessels.
List: Shows a list of AIS and MARPA vessels.
DSC: Shows the DSC list and sets the DSC trails on the chart.
Collision Alarm: Sets the safe-zone collision alarm (Setting the
Safe-Zone Collision Alarm, page 6).
Display Setup: See Showing AIS and MARPA Vessels on a
Chart or on a 3D Chart View, page 5.
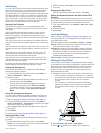
Laylines Settings
When in sailing mode (Setting the Vessel Type, page 2), you
can display laylines on the navigation chart. Laylines can be
very helpful when racing.
From the navigation chart, select Menu > Sailing > Laylines.
Display: Sets how the laylines and vessel are shown on the
chart, and sets the length of the laylines.
Sailing Ang.: Allows you to select how the device calculates
laylines. The Actual option calculates the laylines using the
measured wind angle from the wind sensor. The Manual
option calculates the laylines using manually entered
windward and leeward angles.
Tide Correction: Corrects the laylines based on the tide.
Fish Eye 3D Settings
NOTE: This feature is available with premium charts, in some
areas.
From the Fish Eye 3D chart view, select Menu.
View: Sets the perspective of the 3D chart view.
Tracks: Shows tracks.
Charts and 3D Chart Views 7